|

USD/INR Price Analysis: Bounces off one-week low, remains below 83.00 mark

  • USD/INR states a modest recovery from a one-week low touched this Thursday.
  • The technical setup favours bulls and supports prospects for a further move up.
  • A convincing break below the 100/200-day SMAs will negate the positive bias.

The USD/INR pair attracts some dip-buying near the 82.80 area, or a one-week low touched during the Asian session this Tuesday and for now, seems to have snapped a three-day losing streak. Spot prices, however, remain below the 83.00 round-figure mark, the near-term bias seems tilted in favour of bullish traders.

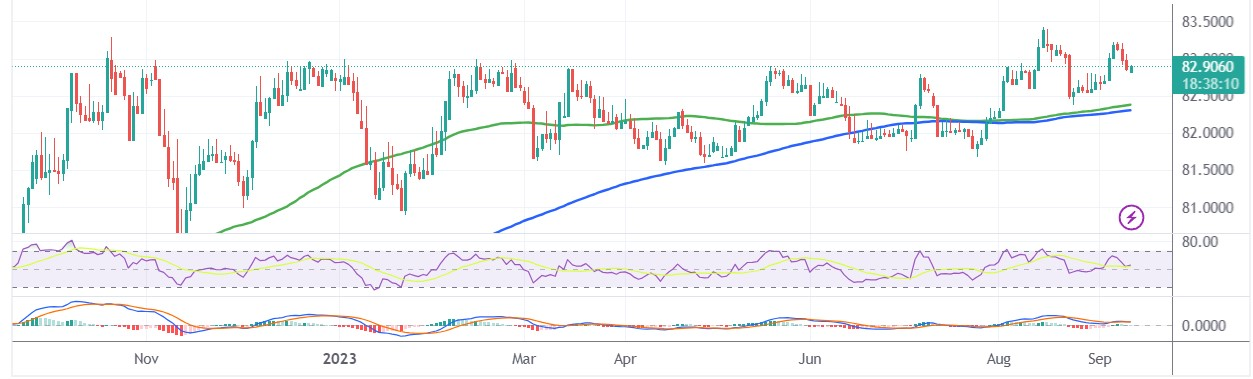
The positive outlook is reinforced by the fact that the USD/INR pair is holding comfortably above technically significant 100-day and 200-day Simple Moving Averages (SMAs). Moreover, positive oscillators on the daily chart – though have been losing some traction – suggest that the path of least resistance for spot prices is to the upside.

A sustained strength beyond the 83.00 mark will reaffirm the constructive setup and lift the pair back towards last week's swing high, around the 83.20-83.25 region. This is followed by the 83.45 region, or the record high touched in August, which if cleared decisively will be seen as a fresh trigger for bulls and pave the way for additional gains.

On the flip side, weakness below the 82.80-82.75 region might continue to attract some dip-buying and remain limited near the 82.40-82.30 confluence, comprising the 100-day and the 200-day SMAs. The latter should act as a pivotal point, which if broken will make the USD/INR pair vulnerable to accelerate the slide towards the 82.00 round figure.

Some follow-through selling below the July monthly swing low, around the 81.70-81.65 region, will suggest that spot prices have formed a near-term top and pave the way for a deeper corrective decline. The USD/INR pair might then weaken further towards the 81.35 intermediate support before eventually dropping towards testing sub-81.00 levels.

USD/INR daily chart

Technical levels to watch

USD/INR

Overview
Today last price82.9182
Today Daily Change0.0316
Today Daily Change %0.04
Today daily open82.8866
 
Trends
Daily SMA2082.9395
Daily SMA5082.6259
Daily SMA10082.4154
Daily SMA20082.3347
 
Levels
Previous Daily High83.125
Previous Daily Low82.8175
Previous Weekly High83.3714
Previous Weekly Low82.585
Previous Monthly High83.5505
Previous Monthly Low82.224
Daily Fibonacci 38.2%82.935
Daily Fibonacci 61.8%83.0076
Daily Pivot Point S182.761
Daily Pivot Point S282.6355
Daily Pivot Point S382.4535
Daily Pivot Point R183.0686
Daily Pivot Point R283.2506
Daily Pivot Point R383.3761

Author

Haresh Menghani

Haresh Menghani is a detail-oriented professional with 10+ years of extensive experience in analysing the global financial markets.

More from Haresh Menghani
Share:

Editor's Picks

EUR/USD retreats below 1.1800 following earlier rebound

EUR/USD loses its recovery momentum and trades little-changed on the day below 1.1300 in the second half of the day on Wednesday. The modest improvement seen in risk mood limits the US Dollar's gains and allows the pair to hold its ground.

GBP/USD clings to small gains above 1.3500

GBP/USD is posting moderate gains above 1.3500 on Wednesday. The pair edges higher as the US Dollar meets fresh supply amid a modest improvement seen in risk sentiment following US President Donald Trump’s first State of the Union address.

Gold rises toward $5,200, supported by geopolitics and trade jitters

Gold buyers are back in the game, eyeing $5,200 and beyonf on Wednesday after seeing a correction from monthly highs on Tuesday. The US Dollar slips after Trump’s SOTU fails to impress and as AI-driven worries ease. Dovish Fed bets also weigh.  Gold looks north so long as the key 61.8% Fibo resistance at $5,142 holds on the daily chart.

Bitcoin, Ethereum and Ripple post cautious recovery amid downside risks

Bitcoin, Ethereum, and Ripple are posting a cautious recovery on Wednesday following a market correction earlier this week.  BTC is approaching a key breakdown level, while ETH and XRP are rebounding from crucial support levels.

Nvidia remains at the heart of the AI boom

Nvidia remains at the heart of the AI boom, with Q4 revenue projected near $65.6–66.1 billion, nearly 70% higher year-over-year. But investors are watching cash flow, leverage, and broader AI adoption. Growth is strong, but the AI stress isn’t over.

Cosmos Hub Price Forecast: ATOM rebounds slightly, bearish outlook remains intact

Cosmos Hub (ATOM) price rebounds, trading above $2.05 at the time of writing on Wednesday, after undergoing a sharp correction since last week. Weakening on-chain and derivatives data support a bearish outlook, while technical analysis remains unfavorable.