|

USD/INR Price Analysis: Bounces off multi-week low, keeps the red below 83.00

  • USD/INR drops to a multi-week low on Friday, though lacks follow-through selling.
  • Oscillators on the daily chart have just started drifting lower and now favour bears. 
  • Any subsequent fall could attract buyers near the 100-day/200-day SMAs confluence.

The USD/INR pair comes under some renewed selling pressure on Friday and touches a nearly three-week low, around the 82.80-82.75 region during the Asian session. Spot prices, however, manage to trim a part of the intraday losses and currently trade just below the 83.00 round figure, still down over 0.20% for the day.

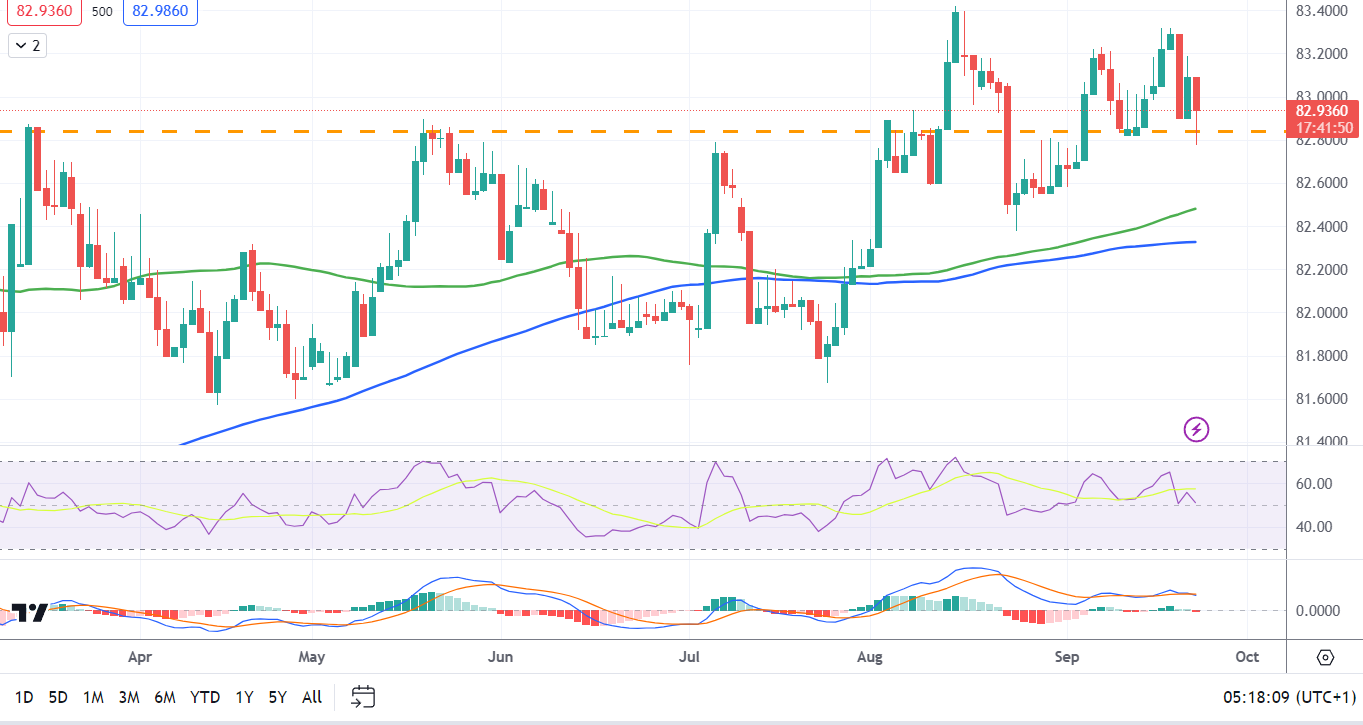
Technical indicators on the daily chart, meanwhile, have just started drifting in the negative territory and support prospects for some meaningful depreciating move. That said, any subsequent decline below the daily trough is likely to find decent support near the 100-day Simple Moving Average (SMA), currently pegged near the 82.45 region. This is closely followed by the 200-day SMA, around the 82.35 zone, which should now act as a key pivotal point for the USD/INR pair.

The latter near the August 24 low, which if broken decisive will be seen as a fresh trigger for bearish traders and prompt aggressive technical selling. Spot prices might then turn vulnerable to accelerate the slide towards the 82.00 mark. The downward trajectory could get extended and eventually drag the USD/INR pair to the July swing low, around the 81.70-81.65 region.

On the flip side, movement above the 83.00-83.05 immediate hurdle now seems to confront resistance near the 82.30 zone ahead of the all-time peak, around the 83.40-83.45 region touched on August 15. A sustained strength beyond will be seen as a fresh trigger for bullish traders and allow the USD/INR pair to conquer the 84.00 round-figure mark.

USD/INR daily chart

fxsoriginal

Technical levels to watch

USD/INR

Overview
Today last price82.9572
Today Daily Change-0.1662
Today Daily Change %-0.20
Today daily open83.1234
 
Trends
Daily SMA2082.9648
Daily SMA5082.7428
Daily SMA10082.5198
Daily SMA20082.3593
 
Levels
Previous Daily High83.2397
Previous Daily Low82.925
Previous Weekly High83.2896
Previous Weekly Low82.5035
Previous Monthly High83.5505
Previous Monthly Low82.224
Daily Fibonacci 38.2%83.1195
Daily Fibonacci 61.8%83.0452
Daily Pivot Point S182.9523
Daily Pivot Point S282.7813
Daily Pivot Point S382.6376
Daily Pivot Point R183.267
Daily Pivot Point R283.4107
Daily Pivot Point R383.5817

Author

Haresh Menghani

Haresh Menghani is a detail-oriented professional with 10+ years of extensive experience in analysing the global financial markets.

More from Haresh Menghani
Share:

Editor's Picks

EUR/USD challenges 1.1800, two-week lows

EUR/USD remains on the defensive, extending its leg lower to the vicinity of the 1.1800 region, or two-week lows, on Tuesday. The move lower comes as the US Dollar gathers further traction ahead of key US data releases, inclusing the FOMC Minutes, on Wednesday.

GBP/USD looks weaker near 1.3500

GBP/USD adds to Monday’s pessimism and puts the 1.3500 support to the test on Tuesday. Cable’s marked pullback comes in response to extra gains in the Greenback while disappointing UK jobs data also collaborate with the offered bias around the British Pound.

Gold loses further momentum, approaches $4,800

Gold recedes to fresh two-week troughs around the $4,800 region per troy ounce on Tuesday. The precious metal builds on Monday’s downtick following a marked rebound in the US Dollar and mixed US Treasury yields across the board.

Crypto Today: Bitcoin, Ethereum, XRP upside looks limited amid deteriorating retail demand

The cryptocurrency market extends weakness with major coins including Bitcoin (BTC), Ethereum (ETH) and Ripple (XRP) trading in sideways price action at the time of writing on Tuesday.

UK jobs market weakens, bolstering rate cut hopes

In the UK, the latest jobs report made for difficult reading. Nonetheless, this represents yet another reminder for the Bank of England that they need to act swiftly given the collapse in inflation expected over the coming months. 

Ripple slides to $1.45 as downside risks surge

Ripple edges lower at the time of writing on Tuesday, from the daily open of $1.48, as headwinds persist across the crypto market. A short-term support is emerging at $1.45, but a buildup of bearish positions could further weaken the derivatives market and prolong the correction.