|

USD/INR Price Analysis: Bears flirt with multi-month-old ascending trend-line support near 82.00

  • USD/INR remains confined in a narrow trading band around the 82.00 mark on Tuesday.
  • Acceptance below the 200-day SMA supports prospects for some meaningful decline.
  • Some follow-through selling below the monthly low will reaffirm the negative outlook.

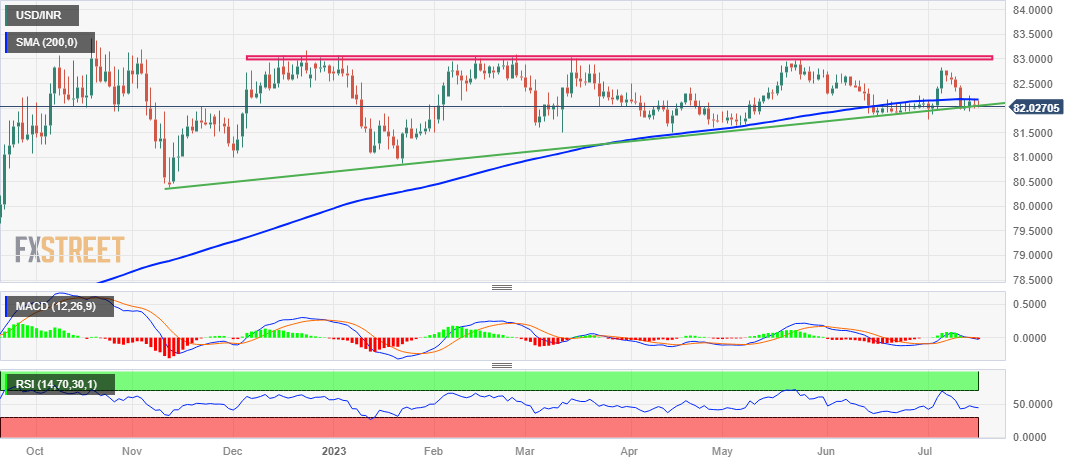
The USD/INR pair edges lower for the second successive day on Tuesday, albeit lacks follow-through selling and remains confined in a familiar multi-day-old trading range. Spot prices currently trade around the 82.00 round figure, with bears now awaiting a sustained breakdown through upward-sloping trend-line support extending from November 2022.

Against the backdrop of the recent repeated failures ahead of the 83.00 mark, acceptance back below a technically significant 200-day Simple Moving Average could be seen as a fresh trigger for bearish traders. Moreover, oscillators on the daily chart have again started drifting in the negative territory and suggest that the path of least resistance for the USD/INR pair is to the downside.

That said, it will still be prudent to wait for some follow-through selling below the monthly low, around the 81.75 region, before traders start positioning for any further depreciating move. The USD/INR pair might then accelerate the slide towards the next relevant support near the 81.50 zone before eventually dropping to test sub-81.00 levels or the YTD low touched in January.

On the flip side, the 82.20 area (200-day SMA) now seems to act as an immediate resistance. A sustained strength beyond will reinforce the ascending trend-line support and the subsequent move up has the potential to lift the USD/INR pair beyond the 82.70-82.75 intermediate hurdle. Bullish traders might then make a fresh attempt to conquer the 83.00 round-figure mark.

The said handle has been acting as a strong barrier since October 2022, which if cleared will mark a fresh bullish breakout and set the stage for an extension of the USD/INR pair's well-established uptrend witnessed since August 2022. Spot prices might then surpass the all-time peak, around the 83.40-83.45 region touched in October 2023, and aim to reclaim the 84.00 mark.

USD/INR daily chart

fxsoriginal

Key levels to watch

USD/INR

Overview
Today last price82.0334
Today Daily Change-0.0289
Today Daily Change %-0.04
Today daily open82.0623
 
Trends
Daily SMA2082.1524
Daily SMA5082.3105
Daily SMA10082.2009
Daily SMA20082.1774
 
Levels
Previous Daily High82.2014
Previous Daily Low81.9966
Previous Weekly High82.7256
Previous Weekly Low81.9215
Previous Monthly High82.737
Previous Monthly Low81.8477
Daily Fibonacci 38.2%82.0748
Daily Fibonacci 61.8%82.1231
Daily Pivot Point S181.9721
Daily Pivot Point S281.8819
Daily Pivot Point S381.7672
Daily Pivot Point R182.1769
Daily Pivot Point R282.2916
Daily Pivot Point R382.3818

Author

Haresh Menghani

Haresh Menghani is a detail-oriented professional with 10+ years of extensive experience in analysing the global financial markets.

More from Haresh Menghani
Share:

Editor's Picks

EUR/USD climbs to daily highs near 1.1820

EUR/USD now picks up pace and advances to the area of daily peaks north of the 1.1800 barrier at the end of the week. The pair’s decent move higher comes against the backdrop of a generalised lack of direction in the FX galaxy and the mild offered stance in the US Dollar.

GBP/USD trims losses, retests 1.3460

After briefly challenging its key 200-day SMA near 1.3440, GBP/USD now manages to regain some balance and revisit the 1.3460 zone on Friday. Cable’s pullback comes as the selling pressure on the Greenback gathers traction, reigniting some recovery in the risk-linked space.

Gold flirts with four-week highs past $5,200

Gold extends its rebound, climbing for a third consecutive session and pushing back above the $5,200 mark per troy ounce on Friday. The move higher continues to draw support from lingering geopolitical tensions and the ongoing uncertainty surrounding US trade policy, both of which are keeping safe-haven demand firmly in play.

Bitcoin, Ethereum and Ripple consolidate with short-term cautious bullish bias

Bitcoin, Ethereum and Ripple are consolidating near key technical areas on Friday, showing mild signs of stabilization after recent volatility. BTC holds above $67,000 despite mild losses so far this week, while ETH hovers around $2,000 after a rejection near its upper consolidation boundary. 

Breaking: US and Israel attack Iran, risk aversion to sweep global markets

Early Saturday, United States (US) President Donald Trump announced that the US had begun “major combat operations” in Iran, following Israel’s pre-emptive missile attacks against Tehran.

Starknet unveils strkBTC, shielded Bitcoin transactions on Ethereum Layer 2

Starknet, the Ethereum Layer 2 network developed by StarkWare, today announced strkBTC, a wrapped Bitcoin asset that introduces optional shielding while preserving full DeFi composability.