|

USD/INR Price Analysis: 200-DMA prods Indian Rupee sellers around 82.10

  • USD/INR picks up bids to extend bounce of seven-month-old ascending support line.
  • RSI rebound from oversold territory favor corrective move in Indian Rupee.
  • 100-DMA acts as extra upside filter before welcoming USD/INR bulls.
  • Multi-month-old symmetrical triangle restricts the pair’s broad moves, suggest further recovery.

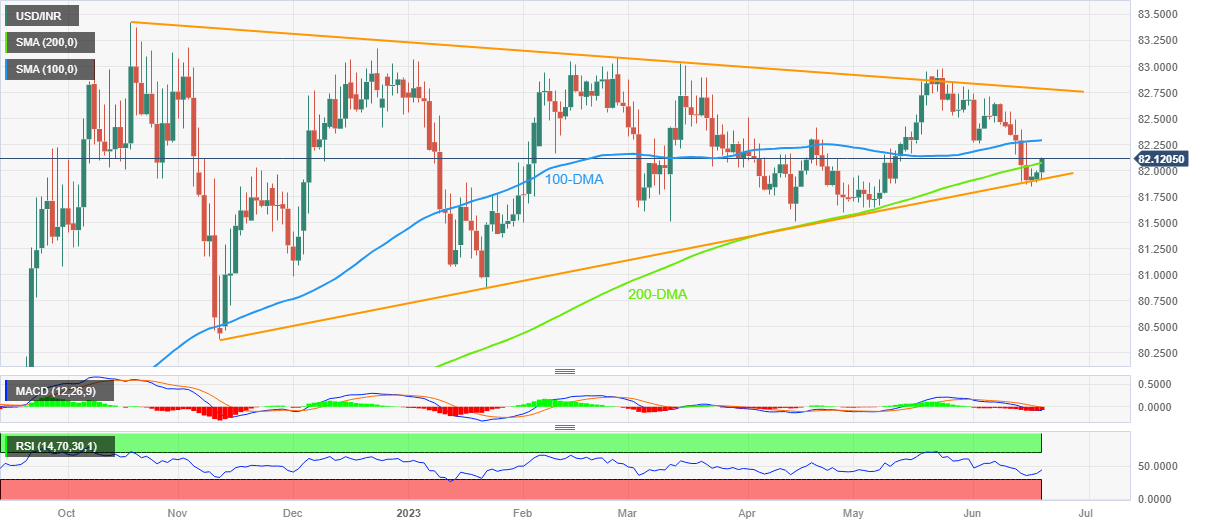
USD/INR renews its intraday high near 82.10 as it prints a three-day uptrend while bouncing off the key support line amid early Tuesday in Europe.

The Indian Rupee (INR) pair’s recovery also takes clues from the RSI (14) line as it improves toward the 50.0 level of late.

However, the bearish MACD signals require the USD/INR pair buyers to wait for a daily closing beyond the 200-DMA hurdle of around 82.10 to retake control. Even so, the 100-DMA resistance of near 82.30 will act as an extra filter toward the north.

Above all, a symmetrical triangle formation established since October 2022 restricts USD/INR moves between 82.00 and 82.80 of late.

That said, the pair’s latest rebound from the support line will please short-term buyers before making them jostle with the 82.80 key hurdle, a break of which could quickly propel the USD/INR price beyond the 83.00 round figure.

On the flip side, a daily closing below the 82.00 support will make the pair vulnerable to refreshing the yearly low, currently around 80.90.  In doing so, April’s bottom of around 81.50 may act as a buffer.

USD/INR: Daily chart

Trend: Further recovery expected

Additional important levels

Overview
Today last price82.0919
Today Daily Change0.1089
Today Daily Change %0.13%
Today daily open81.983
 
Trends
Daily SMA2082.4306
Daily SMA5082.2059
Daily SMA10082.2879
Daily SMA20082.0636
 
Levels
Previous Daily High82.0048
Previous Daily Low81.8895
Previous Weekly High82.568
Previous Weekly Low81.8477
Previous Monthly High82.981
Previous Monthly Low81.6435
Daily Fibonacci 38.2%81.9608
Daily Fibonacci 61.8%81.9335
Daily Pivot Point S181.9134
Daily Pivot Point S281.8438
Daily Pivot Point S381.7981
Daily Pivot Point R182.0287
Daily Pivot Point R282.0744
Daily Pivot Point R382.144

Author

Anil Panchal

Anil Panchal

FXStreet

Anil Panchal has nearly 15 years of experience in tracking financial markets. With a keen interest in macroeconomics, Anil aptly tracks global news/updates and stays well-informed about the global financial moves and their implications.

More from Anil Panchal
Share:

Markets move fast. We move first.

Orange Juice Newsletter brings you expert driven insights - not headlines. Every day on your inbox.

By subscribing you agree to our Terms and conditions.

Editor's Picks

EUR/USD stays defensive below 1.1750 as USD finds its feet

EUR/USD kicks off the new week on a softer note, holding below 1.1750 in European trading on Monday. The pair faces challenges due to a pause in the US Dollar downtrend, with traders shifting their focus to the delayed US Nonfarm Payrolls and CPI data for fresh directives. The ECB policy decision is also eagerly awaited. 

GBP/USD holds steady above 1.3350 as traders await key data and BoE

GBP/USD remains on the back foot above 1.3350 in the European session on Monday, though it lacks bearish conviction and holds above the key 200-day SMA support. The US Dollar holds its recovery mode ahead of key data releases, while the Pound Sterling faces headwinds from the expected BoE rate cut this week. 

Gold climbs to seven-week highs on Fed rate cut bets, safe-haven demand

Gold price rises to seven-week highs to near $4,350 during the early European trading hours on Monday. The precious metal extends its upside amid the prospect of interest rate cuts by the US Fed next year. Lower interest rates could reduce the opportunity cost of holding Gold, supporting the non-yielding precious metal.

Solana consolidates as spot ETF inflows near $1 billion signal institutional dip-buying

Solana price hovers above $131 at the time of writing on Monday, nearing the upper boundary of a falling wedge pattern, awaiting a decisive breakout. On the institutional side, demand for spot Solana Exchange-Traded Funds remained firm, pushing total assets under management to nearly $1 billion since launch. 

Big week ends with big doubts

The S&P 500 continued to push higher yesterday as the US 2-year yield wavered around the 3.50% mark following a Federal Reserve (Fed) rate cut earlier this week that was ultimately perceived as not that hawkish after all. The cut is especially boosting the non-tech pockets of the market.

Solana Price Forecast: SOL consolidates as spot ETF inflows near $1 billion signal institutional dip-buying

Solana (SOL) price hovers above $131 at the time of writing on Monday, nearing the upper boundary of a falling wedge pattern, awaiting a decisive breakout.