USD/INR Price Analysis: 100-DMA probes Indian Rupee buyers at five-week low


  • USD/INR pares recent losses with mild gains around the key support, snaps five-day losing streak.
  • Nearly oversold RSI conditions add strength to recovery expectations.
  • Previous support line from early August, two-month-old horizontal resistance challenge bulls.
  • Lows marked during December, November can entertain bears ahead of 200-DMA.

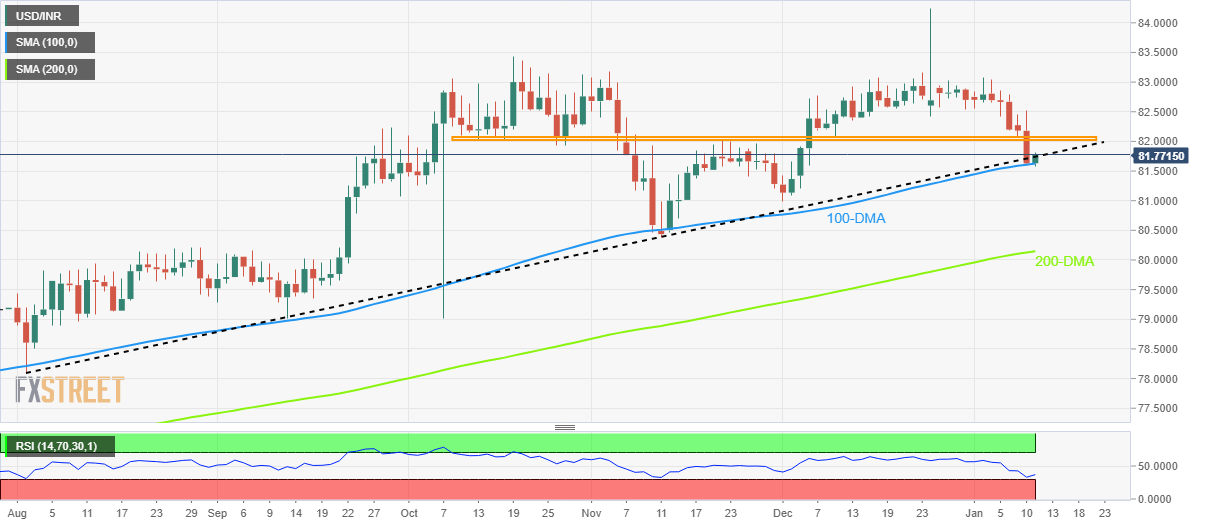
USD/INR rebounds from the lowest levels since December, marked the previous day, as prints the first daily gains around 81.75 on early Wednesday.

In doing so, the Indian Rupee (INR) pair bounces off the 100-DMA as the RSI (14) conditions favor short-covering moves.

However, the USD/INR pair buyers need to stay in the driver’s seat beyond crossing the previous support line from August, close to 81.75 at the latest, for conviction.

Even so, a horizontal resistance area comprising multiple levels marked since October 2022, around 82.10-05, could challenge the USD/INR upside.

It’s worth noting that 82.40 appears the last defense of the USD/INR bears, a break of which could quickly propel the quote towards the 83.00 round figure before highlighting the monthly high surrounding 83.10 for the buyers to trace.

Meanwhile, a daily closing below the 100-DMA level of 81.70 could help the USD/INR sellers to keep the reins.

In that case, the lows marked during December and November of 2022, around 81.00 and 80.37 in that order, could gain the bear’s attention.

Following that, the 200-DMA level surrounding 80.15 and the 80.00 psychological magnet could challenge the USD/INR bears afterward.

USD/INR: Daily chart

Trend: Limited upside expected

Additional important levels

Overview
Today last price 81.674
Today Daily Change 0.0455
Today Daily Change % 0.06%
Today daily open 81.6285
 
Trends
Daily SMA20 82.6311
Daily SMA50 82.089
Daily SMA100 81.6073
Daily SMA200 79.867
 
Levels
Previous Daily High 82.5294
Previous Daily Low 81.5905
Previous Weekly High 83.072
Previous Weekly Low 82.1896
Previous Monthly High 84.25
Previous Monthly Low 80.9855
Daily Fibonacci 38.2% 81.9492
Daily Fibonacci 61.8% 82.1708
Daily Pivot Point S1 81.3029
Daily Pivot Point S2 80.9772
Daily Pivot Point S3 80.3639
Daily Pivot Point R1 82.2418
Daily Pivot Point R2 82.8551
Daily Pivot Point R3 83.1807


Share: Feed news

Information on these pages contains forward-looking statements that involve risks and uncertainties. Markets and instruments profiled on this page are for informational purposes only and should not in any way come across as a recommendation to buy or sell in these assets. You should do your own thorough research before making any investment decisions. FXStreet does not in any way guarantee that this information is free from mistakes, errors, or material misstatements. It also does not guarantee that this information is of a timely nature. Investing in Open Markets involves a great deal of risk, including the loss of all or a portion of your investment, as well as emotional distress. All risks, losses and costs associated with investing, including total loss of principal, are your responsibility. The views and opinions expressed in this article are those of the authors and do not necessarily reflect the official policy or position of FXStreet nor its advertisers. The author will not be held responsible for information that is found at the end of links posted on this page.

If not otherwise explicitly mentioned in the body of the article, at the time of writing, the author has no position in any stock mentioned in this article and no business relationship with any company mentioned. The author has not received compensation for writing this article, other than from FXStreet.

FXStreet and the author do not provide personalized recommendations. The author makes no representations as to the accuracy, completeness, or suitability of this information. FXStreet and the author will not be liable for any errors, omissions or any losses, injuries or damages arising from this information and its display or use. Errors and omissions excepted.

The author and FXStreet are not registered investment advisors and nothing in this article is intended to be investment advice.

XM
Account
7.2
Tools
9.2
Service
9.4
Trading
9.0
Trust
7.0
Experience
8.4
Read review
Moneta Markets
Account
7.4
Tools
6.6
Service
8.0
Trading
6.6
Trust
5.2
Experience
9.2
Read review
Trading Pro
Account
7.2
Tools
5.2
Service
6.6
Trading
8.0
Trust
5.0
Experience
7.0
Read review
Pepperstone
Account
8.2
Tools
8.2
Service
7.4
Trading
9.0
Trust
8.8
Experience
9.0
Read review
XM
Read review
Moneta Markets
Read review
Trading Pro
Read review
Pepperstone
Read review
Trading Pro
Read review
Pepperstone
Read review
XM
Read review
Moneta Markets
Read review
Trading Pro
Account
7.2
Tools
5.2
Service
6.6
Trading
8.0
Trust
5.0
Experience
7.0
Read review
Pepperstone
Account
8.2
Tools
8.2
Service
7.4
Trading
9.0
Trust
8.8
Experience
9.0
Read review
XM
Account
7.2
Tools
9.2
Service
9.4
Trading
9.0
Trust
7.0
Experience
8.4
Read review
Moneta Markets
Account
7.4
Tools
6.6
Service
8.0
Trading
6.6
Trust
5.2
Experience
9.2
Read review

Recommended content


Recommended content

Editors’ Picks

AUD/USD consolidates near two-month top; remains below 0.6400 ahead of Aussie jobs data

AUD/USD consolidates near two-month top; remains below 0.6400 ahead of Aussie jobs data

AUD/USD oscillates below the 0.6400 mark as bulls pause for a breather after the recent sharp rally to a nearly two-month high touched the previous day and ahead of Australian jobs data. The RBA's cautious signal on further interest rate cuts, hopes for more stimulus from China, and Trump's temporary tariff reprieve acts as a tailwind for the Aussie. 

AUD/USD News
USD/JPY stages a recovery from multi-month low; upside seems limited

USD/JPY stages a recovery from multi-month low; upside seems limited

USD/JPY rebounds from the 141.60 area, or a seven-month trough touched during the Asian session on Thursday amid a modest USD bounce, though it lacks follow-through as trade-war woes continue to underpin the safe-haven JPY. 

USD/JPY News
Gold price extends the record run amid US tariffs-inspired rush to safety

Gold price extends the record run amid US tariffs-inspired rush to safety

Gold price builds on the previous day's breakout momentum above the $3,300 mark and touches a fresh all-time peak during the Asian session on Thursday. Tariff uncertainty, the escalating US-China trade war, global recession fears, and expectations of more aggressive Fed easing continue to support XAU/USD.

Gold News
Ethereum face value-accrual risks due to data availability roadmap

Ethereum face value-accrual risks due to data availability roadmap

Ethereum declined 1%, trading just below $1,600 in the early Asian session on Thursday, as Binance Research's latest report suggests that the data availability roadmap has been hampering its value accrual.

Read more
Future-proofing portfolios: A playbook for tariff and recession risks

Future-proofing portfolios: A playbook for tariff and recession risks

It does seem like we will be talking tariffs for a while. And if tariffs stay — in some shape or form — even after negotiations, we’ll likely be talking about recession too. Higher input costs, persistent inflation, and tighter monetary policy are already weighing on global growth. 

Read more
The Best brokers to trade EUR/USD

The Best brokers to trade EUR/USD

SPONSORED Discover the top brokers for trading EUR/USD in 2025. Our list features brokers with competitive spreads, fast execution, and powerful platforms. Whether you're a beginner or an expert, find the right partner to navigate the dynamic Forex market.

Read More

Forex MAJORS

Cryptocurrencies

Signatures

Best Brokers of 2025