USD/INR holds positive ground ahead of Indian WPI inflation, US CPI data
- The Indian Rupee loses ground in Wednesday’s early Asian session.
- Higher crude oil prices and risk aversion dent sentiment and weigh on the INR.
- The Indian WPI inflation and US CPI will be closely watched on Wednesday.

The Indian Rupee (INR) edges lower on Wednesday despite the decline of the US Dollar (USD). The weak domestic markets and the rise of crude oil prices weighed on investor sentiments and dragged the INR lower. Furthermore, risk aversion in the markets amid escalating geopolitical tension in the Middle East limits the local currency’s upside.
On the other hand, the Reserve Bank of India (RBI) is likely to sell USD to stabilize and prevent the INR from a more significant depreciation. Investors will keep an eye on India’s Wholesale Price Index (WPI) inflation, Fuel and Food reports for July. On the US front, the Consumer Price Index (CPI) could offer some hints about the interest rate outlook.
Daily Digest Market Movers: Indian Rupee weakens ahead of PPI report
- The Indian Wholesale Price Index (WPI) inflation is estimated to ease from 3.36% YoY in June to 2.39% in July.
- India and Russia are looking at establishing a benchmark Rupee-Ruble exchange rate to allow direct trade between the two countries, rather than using the USD due to Western sanctions on Moscow, according to the Economic Times.
- The US Producer Price Index (PPI) for final demand in the US came in softer than expected at 2.2% YoY in July, from 2.7% in June, according to the Bureau of Labor Statistics on Tuesday.
- The core PPI, which excludes volatile food and energy prices, rose 2.4% YoY in July, compared to the previous reading of 3.0%, lower than the market consensus of 2.7%.
- On a monthly basis, the headline PPI rose 0.1% in July, while the core PPI remained unchanged in the same period.
- Atlanta Fed President Raphael Bostic said on Tuesday that he is looking for “a little more data” before supporting lower interest rates.
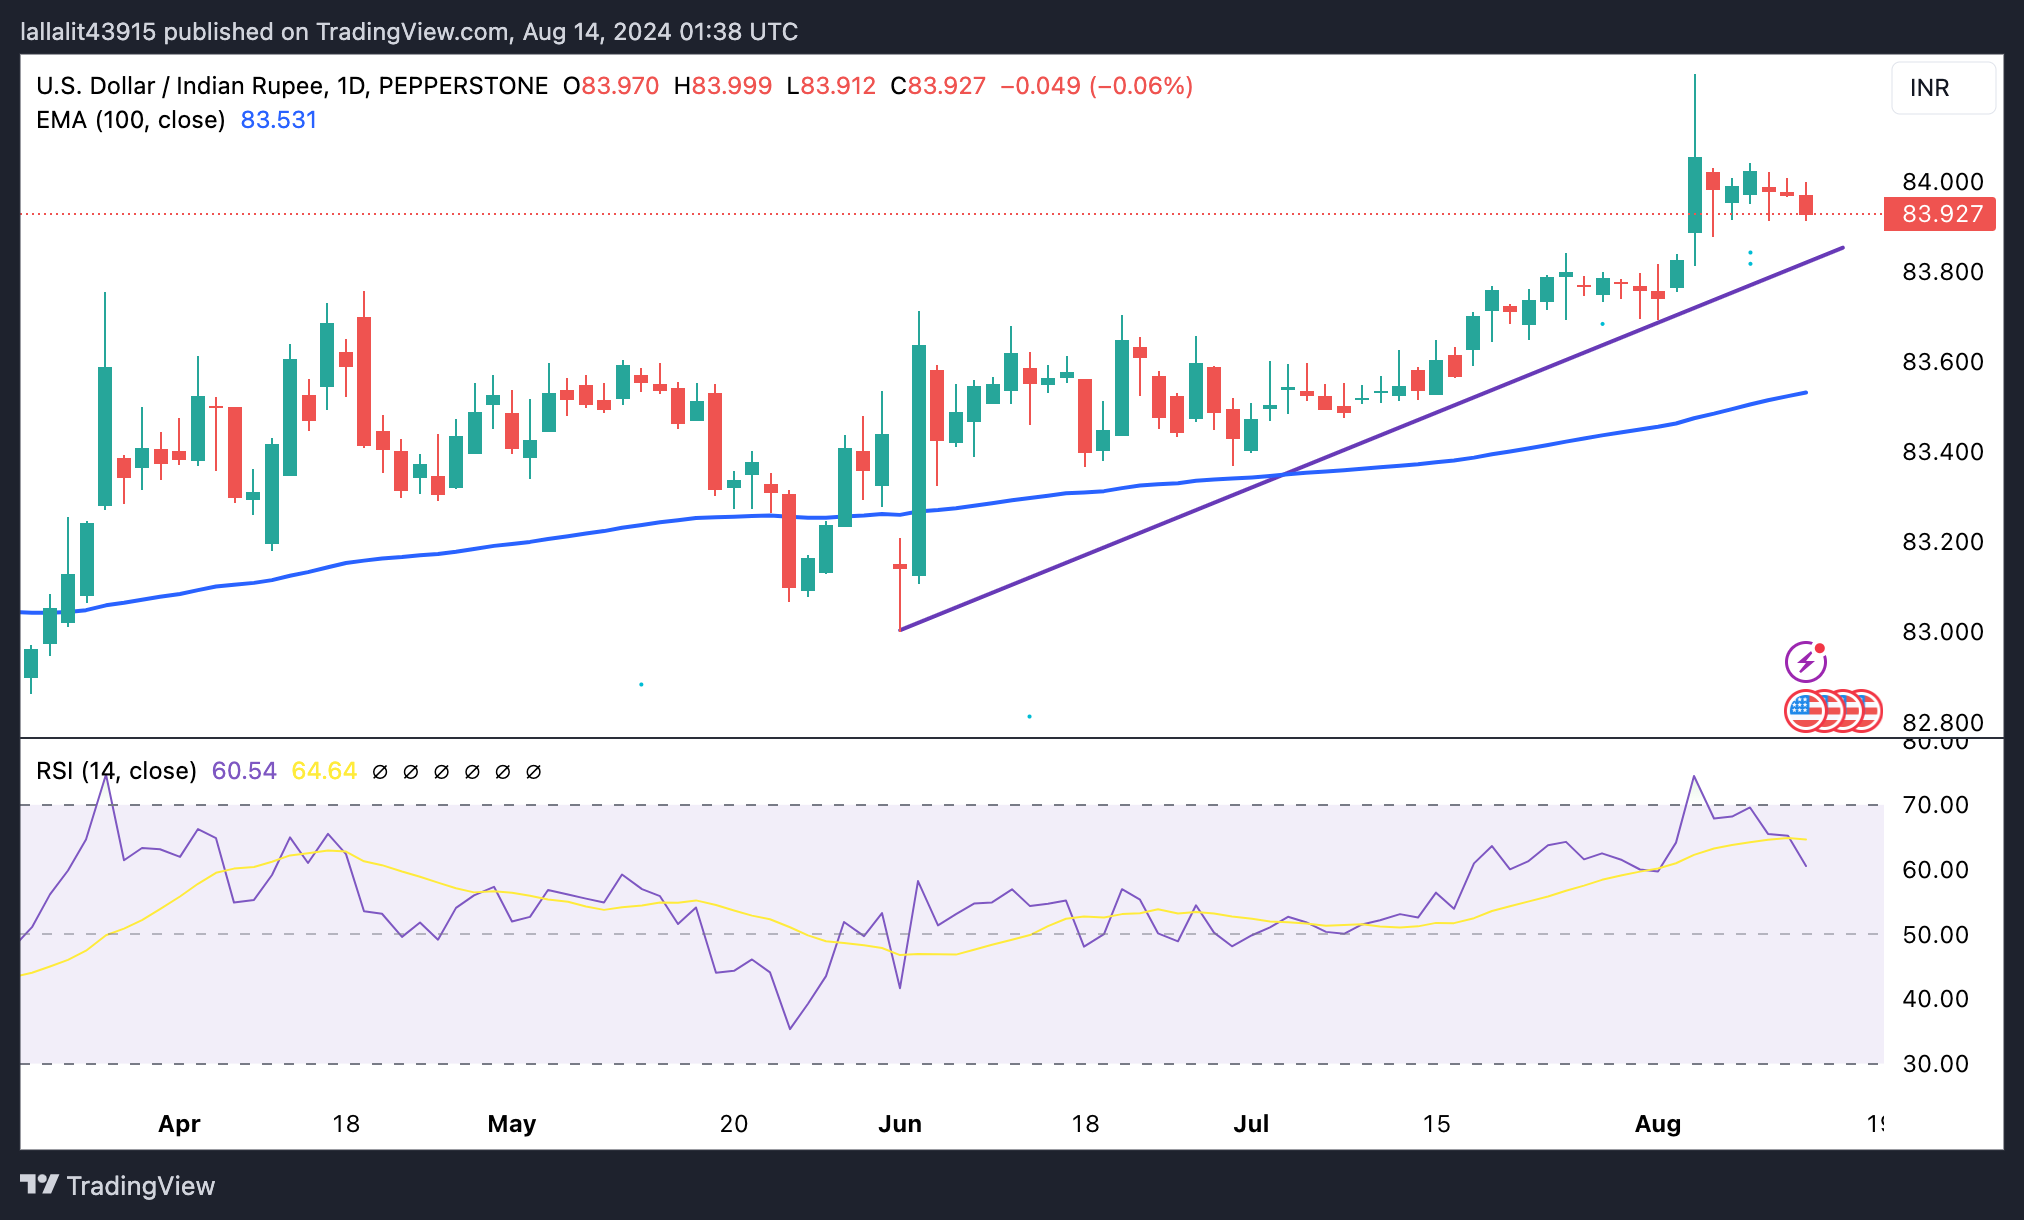
Technical Analysis: USD/INR’s bullish bias persists in the longer term
Indian Rupee trades weaker on the day. According to the daily chart, the positive stance of the USD/INR pair prevails as the pair remains well above the key 100-day Exponential Moving Average (EMA) and the two-month-old uptrend line. The upward momentum is reinforced by the 14-day Relative Strength Index (RSI), which holds above the midline near 60.50, indicating bullish momentum still dominates.
The key upside barrier for USD/INR appears near the 84.00 psychological mark. A sustained move above this level would signal further upside towards the next hurdle at the all-time high of 84.24.
On the downside, the uptrend line at 83.85 appears to be providing some support to the pair. If the price fails to hold this support level, it would pave the way to the 100-day EMA at 83.53.
US Dollar price today
The table below shows the percentage change of US Dollar (USD) against listed major currencies today. US Dollar was the strongest against the .
| USD | EUR | GBP | CAD | AUD | JPY | NZD | CHF | |
| USD | 0.04% | 0.07% | 0.03% | 0.18% | -0.33% | 0.81% | -0.11% | |
| EUR | -0.04% | 0.02% | -0.01% | 0.11% | -0.36% | 0.75% | -0.13% | |
| GBP | -0.07% | -0.02% | -0.03% | 0.09% | -0.38% | 0.74% | -0.18% | |
| CAD | -0.03% | 0.01% | 0.03% | 0.13% | -0.35% | 0.78% | -0.15% | |
| AUD | -0.18% | -0.14% | -0.13% | -0.15% | -0.52% | 0.57% | -0.32% | |
| JPY | 0.36% | 0.39% | 0.35% | 0.31% | 0.48% | 1.14% | 0.23% | |
| NZD | -0.80% | -0.77% | -0.74% | -0.73% | -0.64% | -1.12% | -0.90% | |
| CHF | 0.09% | 0.16% | 0.19% | 0.16% | 0.29% | -0.23% | 0.91% |
The heat map shows percentage changes of major currencies against each other. The base currency is picked from the left column, while the quote currency is picked from the top row. For example, if you pick the Euro from the left column and move along the horizontal line to the Japanese Yen, the percentage change displayed in the box will represent EUR (base)/JPY (quote).
Indian Rupee FAQs
The Indian Rupee (INR) is one of the most sensitive currencies to external factors. The price of Crude Oil (the country is highly dependent on imported Oil), the value of the US Dollar – most trade is conducted in USD – and the level of foreign investment, are all influential. Direct intervention by the Reserve Bank of India (RBI) in FX markets to keep the exchange rate stable, as well as the level of interest rates set by the RBI, are further major influencing factors on the Rupee.
The Reserve Bank of India (RBI) actively intervenes in forex markets to maintain a stable exchange rate, to help facilitate trade. In addition, the RBI tries to maintain the inflation rate at its 4% target by adjusting interest rates. Higher interest rates usually strengthen the Rupee. This is due to the role of the ‘carry trade’ in which investors borrow in countries with lower interest rates so as to place their money in countries’ offering relatively higher interest rates and profit from the difference.
Macroeconomic factors that influence the value of the Rupee include inflation, interest rates, the economic growth rate (GDP), the balance of trade, and inflows from foreign investment. A higher growth rate can lead to more overseas investment, pushing up demand for the Rupee. A less negative balance of trade will eventually lead to a stronger Rupee. Higher interest rates, especially real rates (interest rates less inflation) are also positive for the Rupee. A risk-on environment can lead to greater inflows of Foreign Direct and Indirect Investment (FDI and FII), which also benefit the Rupee.
Higher inflation, particularly, if it is comparatively higher than India’s peers, is generally negative for the currency as it reflects devaluation through oversupply. Inflation also increases the cost of exports, leading to more Rupees being sold to purchase foreign imports, which is Rupee-negative. At the same time, higher inflation usually leads to the Reserve Bank of India (RBI) raising interest rates and this can be positive for the Rupee, due to increased demand from international investors. The opposite effect is true of lower inflation.
Author

Lallalit Srijandorn
FXStreet
Lallalit Srijandorn is a Parisian at heart. She has lived in France since 2019 and now becomes a digital entrepreneur based in Paris and Bangkok.


