USD/INR remains stronger ahead ISM Services PMI
- The Indian Rupee loses momentum in Monday’s early European session.
- The risk-off sentiment, significant foreign outflows and US Dollar demand exert selling pressure on INR.
- The US ISM Services PMI data for July will be in the spotlight on Monday.

The Indian Rupee (INR) remains under pressure after falling to an all-time low at the open on Monday. The sell-off of the INR is backed by the risk-off environment, foreign outflows from India and other emerging markets, and US Dollar (USD) demand from importers. However, the FOMC’s dovish hold and weaker US July employment data might weigh on the Greenback and cap the pair’s upside. Furthermore, the Reserve Bank of India (RBI) is expected to intervene foreign exchange market to prevent the local currency from depreciating.
Looking ahead, investors will monitor the US ISM Services Purchasing Managers Index (PMI) on Monday, which is projected to improve to 51.0 in July from 48.8 in June. On Wednesday, the RBI interest rate decision will take centre stage, with no change in rate expected.
Daily Digest Market Movers: Indian Rupee remains vulnerable amid multiple headwinds
- Indian stock market benchmarks, the Sensex and the Nifty 50 faces some sell-off on Monday amid US recession fears and rising tensions in the Middle East. Around 6.45 GMT, the Nifty 50 was 2.70% down at 24,055, while the BSE Sensex was 2.78% down at 78,735.
- Indian HSBC Services PMI declined to 60.3 in July from 60.5 in the previous reading, weaker than the 61.6 estimated.
- "Service sector activity rose at a slightly slower pace in July, with new business increasing further, primarily driven by domestic demand. Looking ahead, services firms remained optimistic about the outlook for the year-ahead," said Pranjul Bhandari, chief India economist at HSBC.
- The US Nonfarm Payrolls (NFP) increased by 114K in July, down from the revised-lower-figure of 179K in June and below the estimate of 185K, the Labor Department reported on Friday.
- The US Unemployment Rate rose to 4.3% in July from 4.1% in June, the highest level since November 2021.
- The Average Hourly Earnings eased to 0.2% month-over-month in the same reported period, below the market consensus of 0.3%. On an annual basis, the figure decreased to 3.6% from the previous reading of 3.8%.
- Financial markets have priced in nearly 74% odds for a 50 basis-point (bps) cut by the Fed at the September FOMC meeting.
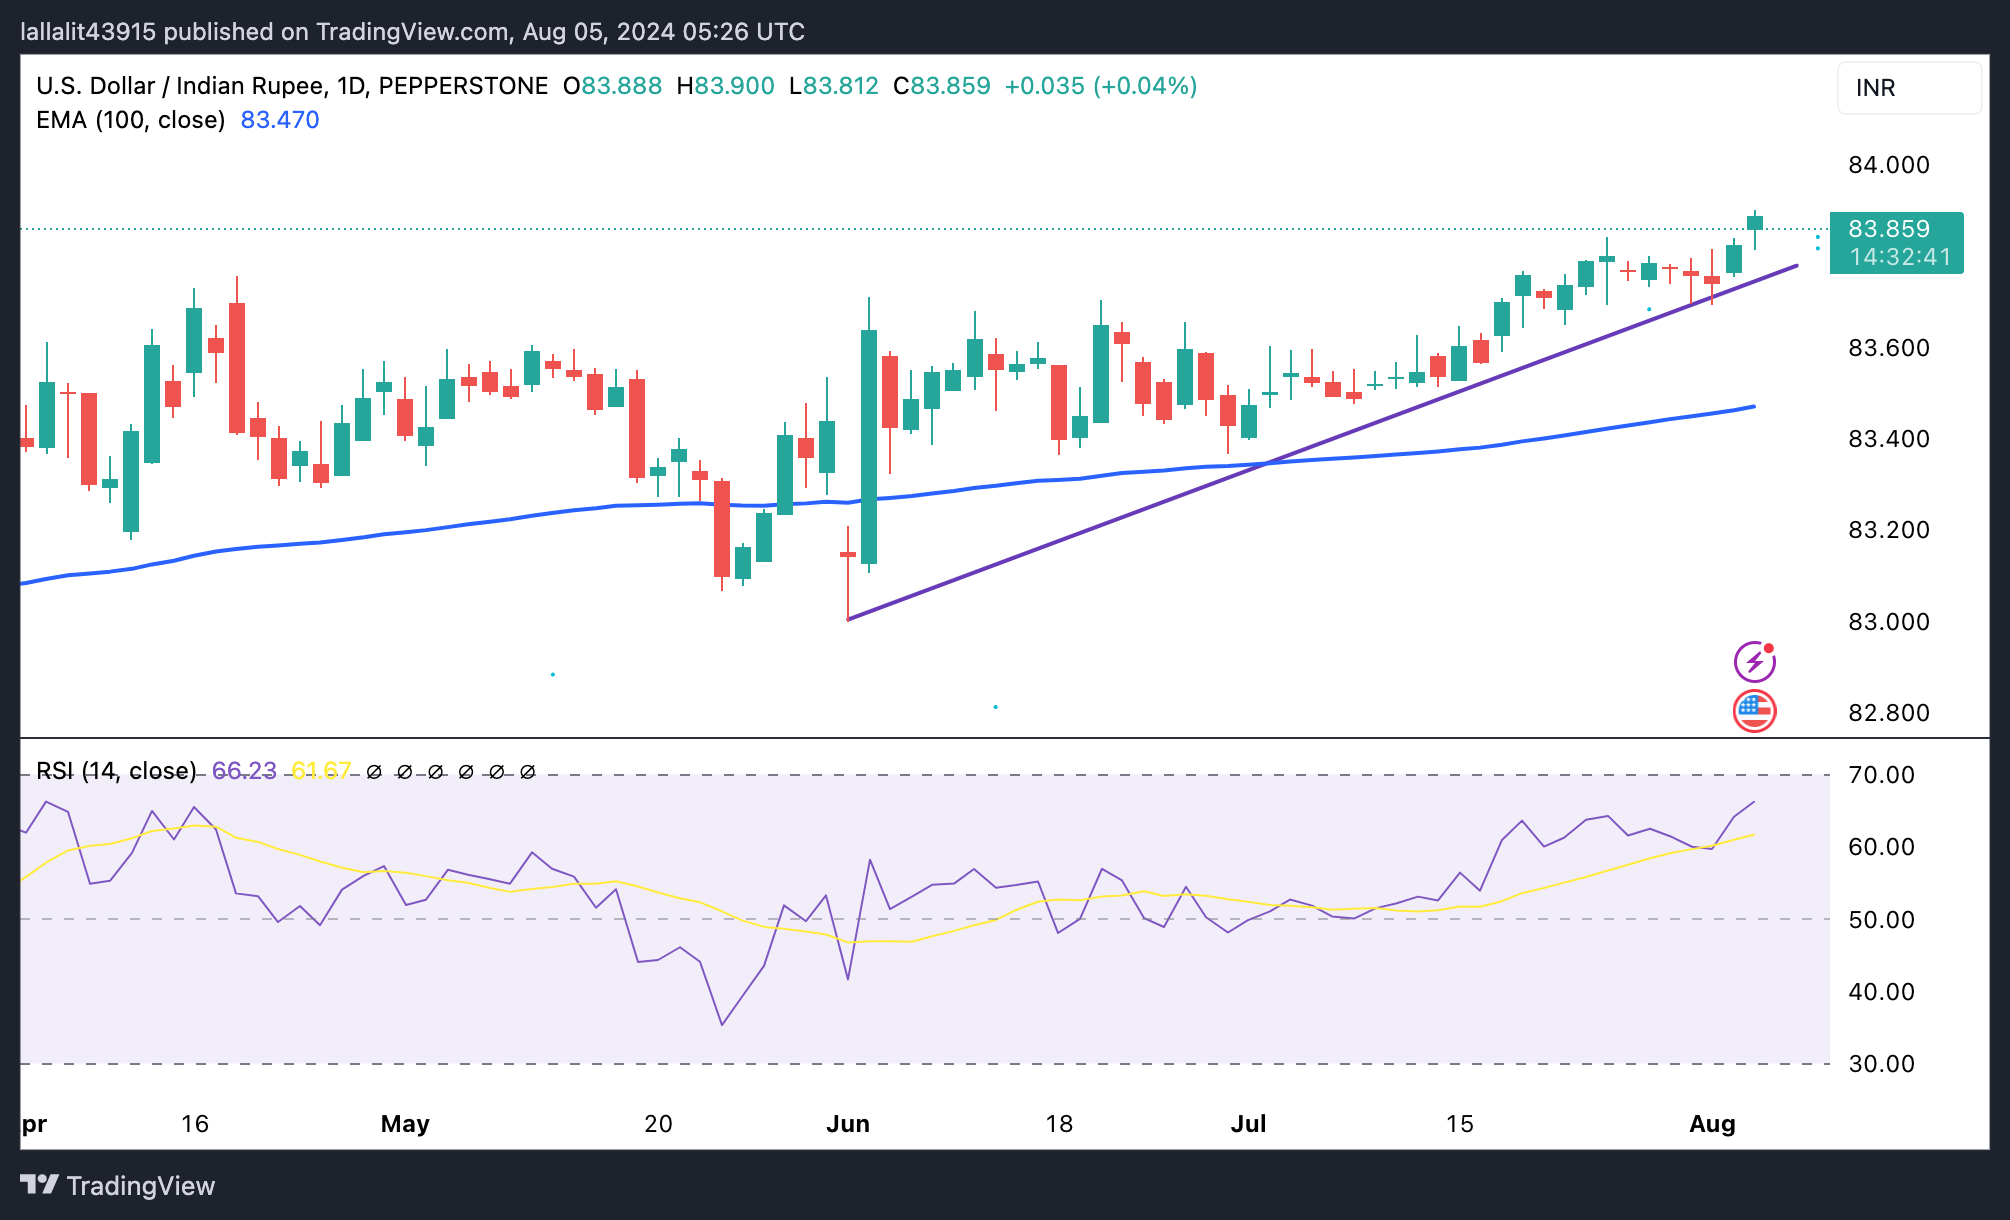
Technical analysis: USD/INR’s bullish bias maintains strength
Indian Rupee weakens on the day. The positive stance of the USD/INR remains intact, with the pair holding above the key 100-day Exponential Moving Average (EMA) and being supported by the uptrend line since June 3 on the daily chart. The upward momentum is also underpinned by the 14-day Relative Strength Index (RSI), which stands above the midline near 65.0, suggesting a further upside looks favourable.
A decisive bullish breakout above the all-time high of 83.85 will attract some buyers to the 84.00 psychological level, followed by 83.50.
The first downside target emerges near the uptrend line around 83.75. A breach of this level will see a drop to 83.51, a low of July 12. The potential support level to watch is 83.47, the 100-day EMA.
US Dollar PRICE Today
The table below shows the percentage change of US Dollar (USD) against listed major currencies today. US Dollar was the strongest against the Australian Dollar.
| USD | EUR | GBP | JPY | CAD | AUD | NZD | INR | |
|---|---|---|---|---|---|---|---|---|
| USD | -0.50% | 0.03% | -2.54% | -0.03% | 0.93% | 0.49% | 0.09% | |
| EUR | 0.50% | 0.46% | -2.19% | 0.36% | 1.46% | 0.90% | 1.50% | |
| GBP | -0.03% | -0.46% | -2.58% | -0.08% | 1.00% | 0.44% | 0.08% | |
| JPY | 2.54% | 2.19% | 2.58% | 2.65% | 3.55% | 3.16% | 3.80% | |
| CAD | 0.03% | -0.36% | 0.08% | -2.65% | 0.99% | 0.52% | 1.10% | |
| AUD | -0.93% | -1.46% | -1.00% | -3.55% | -0.99% | -0.56% | -0.03% | |
| NZD | -0.49% | -0.90% | -0.44% | -3.16% | -0.52% | 0.56% | -0.41% | |
| INR | -0.09% | -1.50% | -0.08% | -3.80% | -1.10% | 0.03% | 0.41% |
The heat map shows percentage changes of major currencies against each other. The base currency is picked from the left column, while the quote currency is picked from the top row. For example, if you pick the US Dollar from the left column and move along the horizontal line to the Japanese Yen, the percentage change displayed in the box will represent USD (base)/JPY (quote).
Economic Indicator
ISM Services PMI
The Institute for Supply Management (ISM) Services Purchasing Managers Index (PMI), released on a monthly basis, is a leading indicator gauging business activity in the US services sector, which makes up most of the economy. The indicator is obtained from a survey of supply executives across the US based on information they have collected within their respective organizations. Survey responses reflect the change, if any, in the current month compared to the previous month. A reading above 50 indicates that the services economy is generally expanding, a bullish sign for the US Dollar (USD). A reading below 50 signals that services sector activity is generally declining, which is seen as bearish for USD.
Read more.Next release: Mon Aug 05, 2024 14:00
Frequency: Monthly
Consensus: 51
Previous: 48.8
Source: Institute for Supply Management
The Institute for Supply Management’s (ISM) Services Purchasing Managers Index (PMI) reveals the current conditions in the US service sector, which has historically been a large GDP contributor. A print above 50 shows expansion in the service sector’s economic activity. Stronger-than-expected readings usually help the USD gather strength against its rivals. In addition to the headline PMI, the Employment Index and the Prices Paid Index numbers are also watched closely by investors as they provide useful insights regarding the state of the labour market and inflation.
Author

Lallalit Srijandorn
FXStreet
Lallalit Srijandorn is a Parisian at heart. She has lived in France since 2019 and now becomes a digital entrepreneur based in Paris and Bangkok.


