|
USD Index Price Analysis: Initial resistance now comes at 104.40
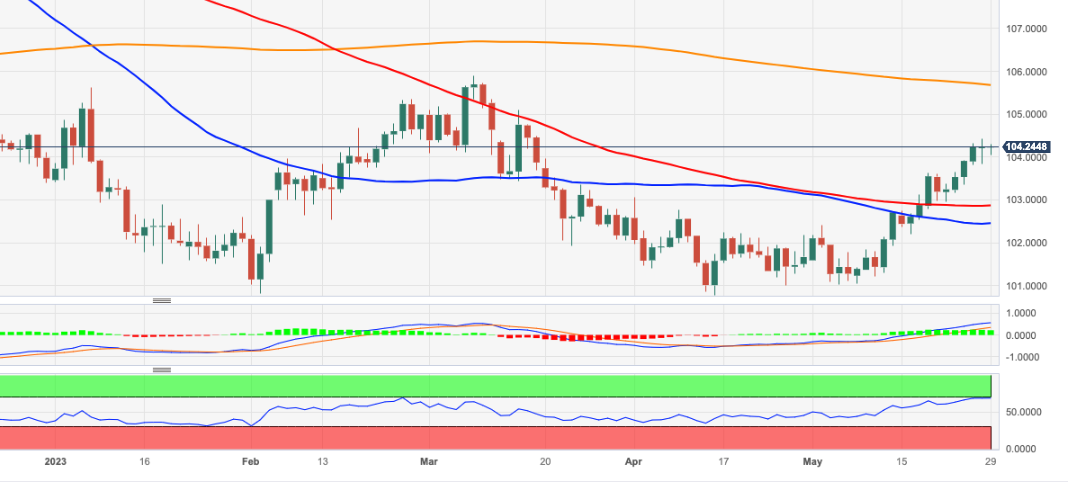
- DXY treads water around 104.20/30 at the beginning of the week.
- Further upside needs to clear the May top at 104.41.

DXY struggles to extend further the May rally on Monday.
Further upside appears on the cards in the near term. That said, the surpass of the May high at 104.41 (May 26) should put a potential visit to the key 200-day SMA, today at 105.67, back on the radar ahead of the 2023 peak of 105.88 (March 8).
Looking at the broader picture, while below the 200-day SMA the outlook for the index is expected to remain negative.
DXY daily chart
Author

Pablo Piovano
FXStreet
Born and bred in Argentina, Pablo has been carrying on with his passion for FX markets and trading since his first college years.
More from Pablo Piovano


