USD/IDR technical analysis: Struggles between 200-DMA and 61.8% Fibo.
- Key technical indicators restrict USD/IDR moves.
- Sustained trading beyond a long-term DMA, normal RSI favor the buyers.

USD/IDR registers another bounce off 200-day simple moving average (DMA) as it trades near 14,315 during Thursday’s Asian session.
The pair has been choppy between 200-DMA and 61.8% Fibonacci retracement of April-June declines off-late. Though, a sustained trading above key DMA favors USD/IDR buyers targeting another run-up to 61.8% Fibonacci retracement near 14,350.
Should prices manage to clear 14,350, June 17 high around 14,420 and monthly top surrounding 14,580 will be up on bulls’ radars.
On the downside break below 200-DMA level of 14,224 can quickly fetch prices to 38.2% Fibonacci retracement level around 14,120 whereas a 10-week-old rising trend-line at 14,043 will limit pair’s further declines.
In a case where USD/IDR slips beneath 14,043, 14,000 round-figure and July 19 low near 13,884 will be bears’ favorites.
USD/IDR daily chart
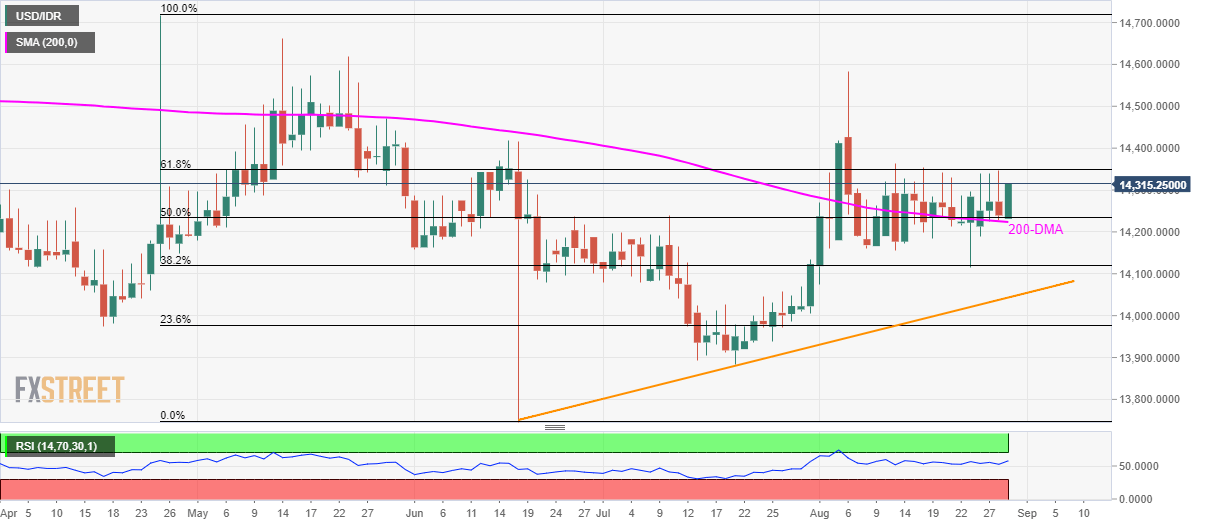
Trend: sideways
Author

Anil Panchal
FXStreet
Anil Panchal has nearly 15 years of experience in tracking financial markets. With a keen interest in macroeconomics, Anil aptly tracks global news/updates and stays well-informed about the global financial moves and their implications.


