USD/IDR Technical Analysis: Struggles between 14,130/20 support-confluence and 23.6% Fibo.

In spite of multiple failures to rise past-14,230, the USD/IDR still couldn’t break 14,130/20 support-confluence and is currently trading near 14,160 during early Thursday.
Should prices slip beneath 14,130/20 support-confluence comprising 50-day simple moving average (SMA) and two-month-old ascending trend-line, 14,070 can act as an intermediate halt ahead of dragging the quote to 14,000 round-figure during further declines.
Moreover, bears’ dominance past-14,000 could push them to February 25 low near 13,950 and 13,900 while 2019 low near 13,860 may flash on their radar afterward.
On the upside break of 14,230 immediate resistance, also including 23.6% Fibonacci retracement of its October 2018 to February 2019 downturn, a fortnight old downward sloping trend-line, around 14,300, may gain buyers’ attention. Also, a break of 14,300 can make 14,350 and 14,450 as optimists’ favorites.
If at all price keep rising past-14,450 that also represents 38.2% Fibonacci retracement, 14,510 and 14,640 including 50% Fibonacci retracement could please the Bulls.
USD/IDR daily chart
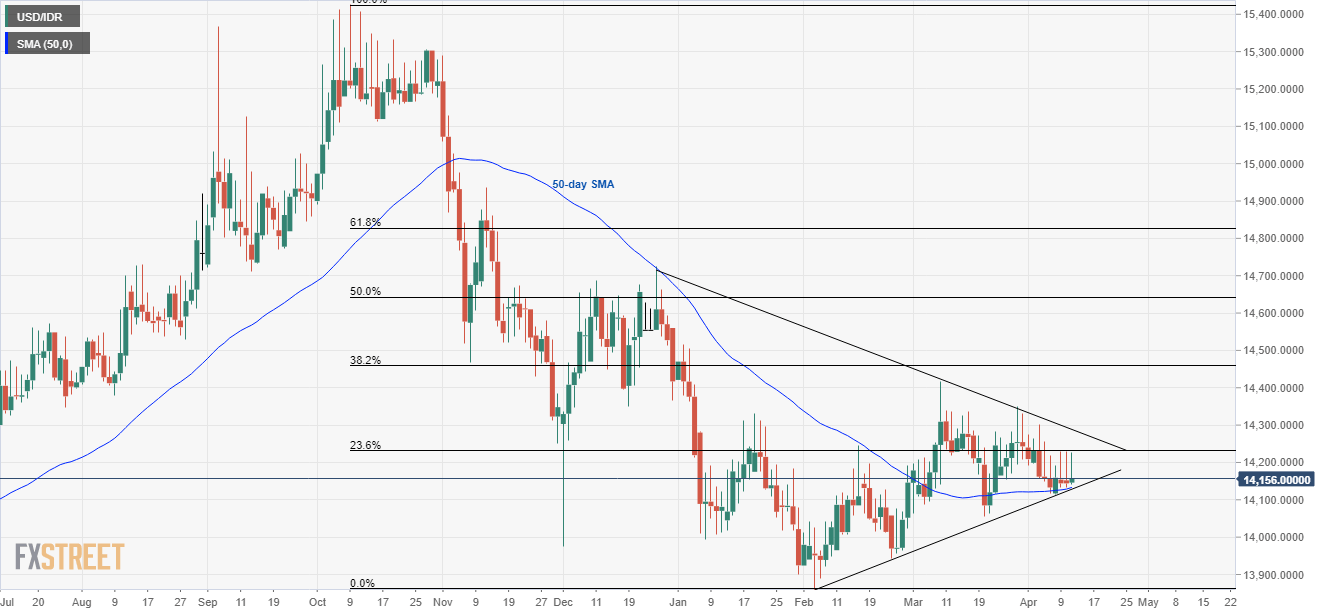
Trend: Sideways
Author

Anil Panchal
FXStreet
Anil Panchal has nearly 15 years of experience in tracking financial markets. With a keen interest in macroeconomics, Anil aptly tracks global news/updates and stays well-informed about the global financial moves and their implications.


