USD/IDR Price Analysis: Ignores bearish spinning top for 21-day EMA


  • USD/IDR shrugs off the previous day’s decline, turning mildly positive for the week.
  • Sustained trading below 13,600 will trigger a fresh round of selling.
  • An eight-week-old falling trend line adds to the resistance.

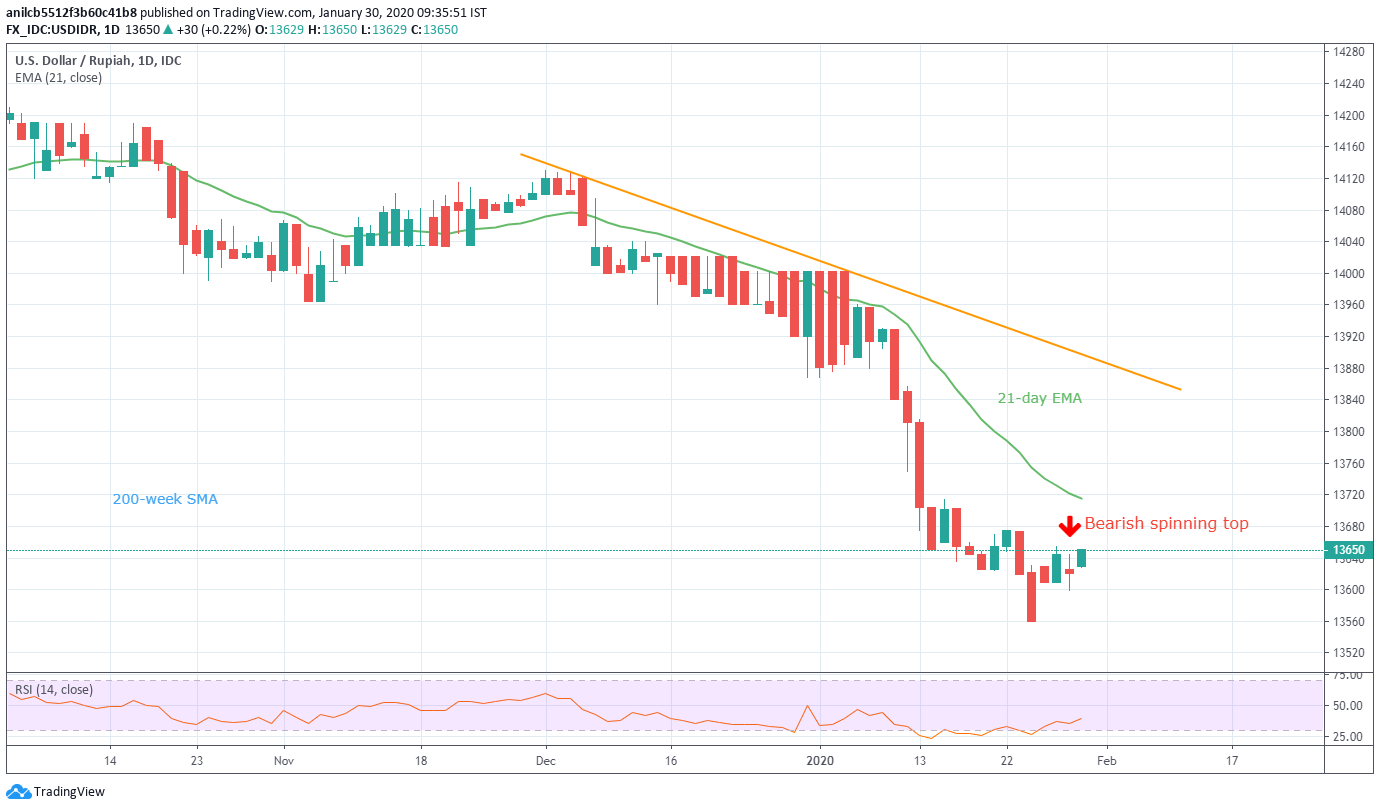
USD/IDR flashes an intraday high of 13,650 ahead of the European session on Thursday. In doing so, the pair ignores the previous day’s bearish spinning top candlestick formation while rising towards 21-day EMA.

Ahead of the 21-day EMA level of 13,715, last week’s top near 13,675 can offer an intermediate halt.

It should, however, be noted that a sustained break of 13,715 will be the key to pair’s run-up towards an eight-week-old resistance line, at 13,900 now.

On the contrary, sellers will look for entry below 13,600 to target the monthly bottom surrounding 13,560. Though, pair’s further declines could aim for 13,450 and the year 2018 bottom close to 13,255.

USD/IDR daily chart

Trend: Further recovery expected

Additional important levels

Overview
Today last price 13658.8
Today Daily Change 31.8000
Today Daily Change % 0.23%
Today daily open 13627
 
Trends
Daily SMA20 13733.725
Daily SMA50 13897.6349
Daily SMA100 13996.259
Daily SMA200 14102.7817
 
Levels
Previous Daily High 13677
Previous Daily Low 13591.993
Previous Weekly High 13716
Previous Weekly Low 13521.5
Previous Monthly High 14181.2945
Previous Monthly Low 13676.9335
Daily Fibonacci 38.2% 13624.4657
Daily Fibonacci 61.8% 13644.5273
Daily Pivot Point S1 13586.9953
Daily Pivot Point S2 13546.9907
Daily Pivot Point S3 13501.9883
Daily Pivot Point R1 13672.0023
Daily Pivot Point R2 13717.0047
Daily Pivot Point R3 13757.0093


Share: Feed news

Information on these pages contains forward-looking statements that involve risks and uncertainties. Markets and instruments profiled on this page are for informational purposes only and should not in any way come across as a recommendation to buy or sell in these assets. You should do your own thorough research before making any investment decisions. FXStreet does not in any way guarantee that this information is free from mistakes, errors, or material misstatements. It also does not guarantee that this information is of a timely nature. Investing in Open Markets involves a great deal of risk, including the loss of all or a portion of your investment, as well as emotional distress. All risks, losses and costs associated with investing, including total loss of principal, are your responsibility. The views and opinions expressed in this article are those of the authors and do not necessarily reflect the official policy or position of FXStreet nor its advertisers. The author will not be held responsible for information that is found at the end of links posted on this page.

If not otherwise explicitly mentioned in the body of the article, at the time of writing, the author has no position in any stock mentioned in this article and no business relationship with any company mentioned. The author has not received compensation for writing this article, other than from FXStreet.

FXStreet and the author do not provide personalized recommendations. The author makes no representations as to the accuracy, completeness, or suitability of this information. FXStreet and the author will not be liable for any errors, omissions or any losses, injuries or damages arising from this information and its display or use. Errors and omissions excepted.

The author and FXStreet are not registered investment advisors and nothing in this article is intended to be investment advice.

Recommended content


Recommended content

Editors’ Picks

EUR/USD nears 1.1200 after US PCE inflation data

EUR/USD nears 1.1200 after US PCE inflation data

EUR/USD approaches 1.1200 following generally softer-than-anticipated US inflation-related figures. The pair lacks momentum amid tepid European data undermining demand for the Euro. Still, optimism weighs on the USD.

EUR/USD News
GBP/USD battles the 1.3400 level for a definitive bullish breakout

GBP/USD battles the 1.3400 level for a definitive bullish breakout

GBP/USD advances modestly beyond the 1.3400 level after US PCE inflation data showed price pressures continued to recede in August. Sterling Pound aims for fresh yearly highs beyond the 1.3433 peak posted earlier this week. 

GBP/USD News
Gold hovers around $2,670 as US Dollar resumes decline

Gold hovers around $2,670 as US Dollar resumes decline

Gold price retains its bullish bias near fresh record highs, as demand for the US Dollar remains subdued following US PCE inflation figures. The strong momentum around stocks limits demand for the safe-haven metal. 


Gold News
Week ahead – NFP on tap amid bets of another bold Fed rate cut

Week ahead – NFP on tap amid bets of another bold Fed rate cut

Investors see decent chance of another 50bps cut in November. Fed speakers, ISM PMIs and NFP to shape rate cut bets. Eurozone CPI data awaited amid bets for more ECB cuts. China PMIs and BoJ Summary of Opinions also on tap.

Read more
RBA widely expected to keep key interest rate unchanged amid persisting price pressures

RBA widely expected to keep key interest rate unchanged amid persisting price pressures

The Reserve Bank of Australia is likely to continue bucking the trend adopted by major central banks of the dovish policy pivot, opting to maintain the policy for the seventh consecutive meeting on Tuesday.

Read more
Five best Forex brokers in 2024

Five best Forex brokers in 2024

VERIFIED Choosing the best Forex broker in 2024 requires careful consideration of certain essential factors. With the wide array of options available, it is crucial to find a broker that aligns with your trading style, experience level, and financial goals. 

Read More

Forex MAJORS

Cryptocurrencies

Signatures