|

USD/CNH Price Analysis: Yuan bears take a breather at 6.5-month low within channel pattern, Fed eyed

  • USD/CNH seesaws at the highest levels since late November 2022, mildly offered of late.
  • Overbought RSI conditions prod buyers within one-week-old rising trend channel.
  • Hopes of hawkish Fed halt, bullish MACD signals join sustained trading above the key moving average to favor Yuan bears.

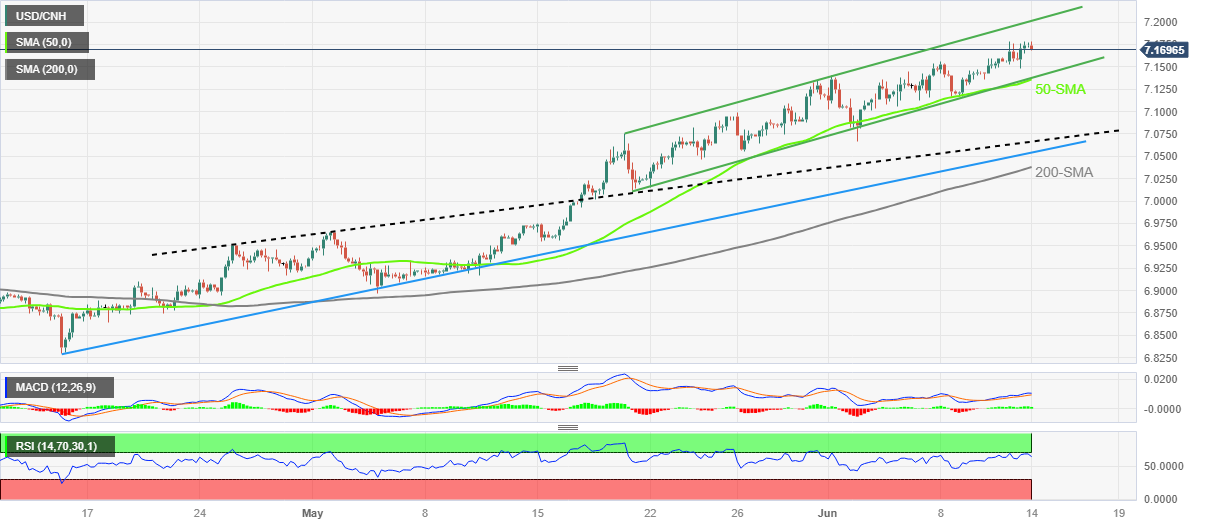
USD/CNH struggles to extend a three-day uptrend as it retreats from the highest levels in nearly eight months on the key Federal Open Market Committee (FOMC) monetary policy meeting day. That said, the offshore Chinese Yuan (CNH) pair prints mild losses near 7.1720 by the press time, after rising to the highest levels since April 2022 with the latest peak of 7.1788.

It’s worth noting that the overbought RSI conditions join the pre-Fed anxiety to challenge the USD/CNH traders within a one-week-old rising trend channel, currently between 7.2020 and 7.1350 at the latest. Adding strength to the 7.1350 support level is the 50-SMA.

In a case where the USD/CNH drops below 7.1350, the previous resistance line stretched from late April, close to 7.0680, will precede a two-month-old rising support line, surrounding 7.0570 as we write, to please the offshore Chinese Yuan buyers.

However, the 200-SMA level of 7.0380 acts as the last defense of the USD/CNH bulls before giving control to the bears.

On the flip side, USD/CNH run-up needs validation from the latest high of around 7.1788, as well as the 7.1800 round figure.

Following that, the 7.2000 psychological magnet may prod the pair buyers before directing them to the short-term rising channel’s top line, close to 7.2020.

Should the offshore Chinese Yuan (CNH) remains bearish past 7.2020, the odds of witnessing the pair’s rally towards the late November 2022 peak of near 7.2600 can’t be ruled out.

USD/CNH: Four-hour chart

Trend: Pullback expected

Additional important levels

Overview
Today last price7.1714
Today Daily Change-0.0054
Today Daily Change %-0.08%
Today daily open7.1768
 
Trends
Daily SMA207.0964
Daily SMA506.988
Daily SMA1006.9258
Daily SMA2006.9888
 
Levels
Previous Daily High7.1788
Previous Daily Low7.1484
Previous Weekly High7.1558
Previous Weekly Low7.1012
Previous Monthly High7.1344
Previous Monthly Low6.8962
Daily Fibonacci 38.2%7.1672
Daily Fibonacci 61.8%7.1601
Daily Pivot Point S17.1572
Daily Pivot Point S27.1376
Daily Pivot Point S37.1268
Daily Pivot Point R17.1876
Daily Pivot Point R27.1984
Daily Pivot Point R37.218

Author

Anil Panchal

Anil Panchal

FXStreet

Anil Panchal has nearly 15 years of experience in tracking financial markets. With a keen interest in macroeconomics, Anil aptly tracks global news/updates and stays well-informed about the global financial moves and their implications.

More from Anil Panchal
Share:

Markets move fast. We move first.

Orange Juice Newsletter brings you expert driven insights - not headlines. Every day on your inbox.

By subscribing you agree to our Terms and conditions.

Editor's Picks

EUR/USD clings to small gains near 1.1750

Following a short-lasting correction in the early European session, EUR/USD regains its traction and clings to moderate gains at around 1.1750 on Monday. Nevertheless, the pair's volatility remains low, with investors awaiting this weeks key data releases from the US and the ECB policy announcements.

GBP/USD edges higher toward 1.3400 ahead of US data and BoE

GBP/USD reverses its direction and advances toward 1.3400 following a drop to the 1.3350 area earlier in the day. The US Dollar struggles to gather recovery momentum as markets await Tuesday's Nonfarm Payrolls data, while the Pound Sterling holds steady ahead of the BoE policy announcements later in the week.

Gold pulls away from session high, holds above $4,300

Gold loses its bullish momentum and retreats below $4,350 after testing this level earlier on Monday. XAU/USD, however, stays in positive territory as the US Dollar remains on the back foot on growing expectations for a dovish Fed policy outlook next year.

Solana consolidates as spot ETF inflows near $1 billion signal institutional dip-buying

Solana price hovers above $131 at the time of writing on Monday, nearing the upper boundary of a falling wedge pattern, awaiting a decisive breakout. On the institutional side, demand for spot Solana Exchange-Traded Funds remained firm, pushing total assets under management to nearly $1 billion since launch. 

Big week ends with big doubts

The S&P 500 continued to push higher yesterday as the US 2-year yield wavered around the 3.50% mark following a Federal Reserve (Fed) rate cut earlier this week that was ultimately perceived as not that hawkish after all. The cut is especially boosting the non-tech pockets of the market.

Solana Price Forecast: SOL consolidates as spot ETF inflows near $1 billion signal institutional dip-buying

Solana (SOL) price hovers above $131 at the time of writing on Monday, nearing the upper boundary of a falling wedge pattern, awaiting a decisive breakout.