USD/CNH Price Analysis: Retreats inside bull flag, 6.9150 is the trigger
- USD/CNH fades the previous day’s corrective bounce from the weekly bottom but stay inside a bullish chart pattern.
- Steady RSI, sustained trading beyond fortnight-old support line, 50-SMA also favor buyers.
- Sellers need validation from 6.8820, May’s high to retake control.
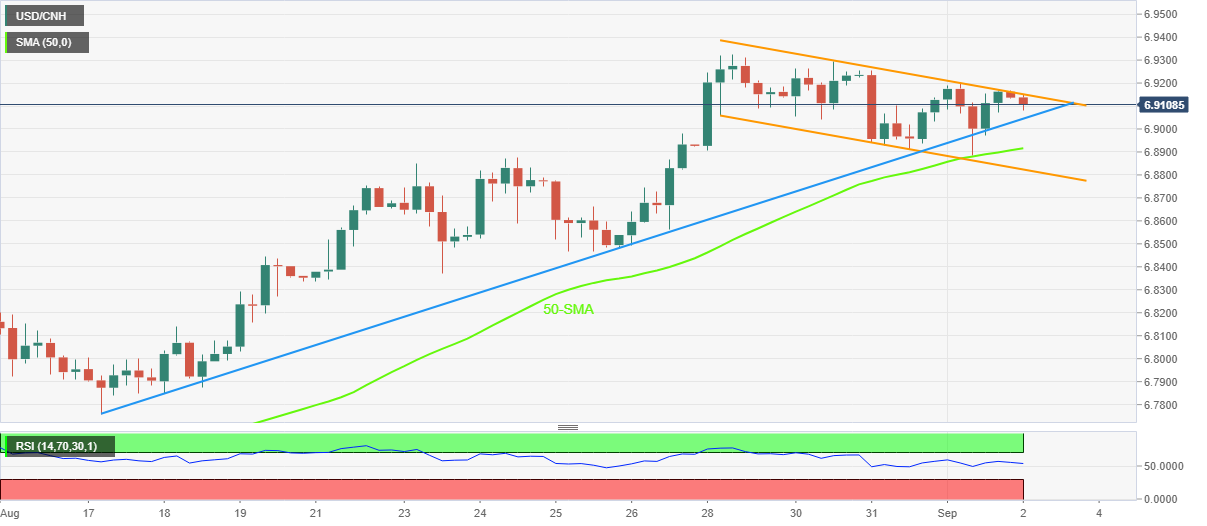
USD/CNH portrays a bullish chart pattern around the two-year high as it drops back to 6.9100 during Friday’s Asian session. In doing so, the offshore Chinese yuan (CNH) pair reverses the previous day’s rebound from the weekly low.
However, steady RSI and the quote’s ability to stay firmer past a two-week-old support line and the 50-SMA keep the USD/CNH buyers hopeful.
In addition to the aforementioned support line and the 50-SMA, close to 6.9050 and 6.8910 in that order, the lower line of the stated channel could also test the bearish bias around 6.8820.
Even if the USD/CNH bears conquer the 6.8820 support, the May 2022 peak surrounding 6.8385 could challenge the pair’s further downside.
Meanwhile, the pair’s upside moves need a sustained break of the 6.9150 hurdle to justify the bullish flag.
Following that, the recent multi-month high near 6.9325-30 could entertain the USD/CNH bulls before the theoretical target surrounding 7.0550. During the run-up, the 7.000 psychological magnet will be crucial to watch.
USD/CNH: Four-hour chart
Trend: Further upside expected
Author

Anil Panchal
FXStreet
Anil Panchal has nearly 15 years of experience in tracking financial markets. With a keen interest in macroeconomics, Anil aptly tracks global news/updates and stays well-informed about the global financial moves and their implications.


