|

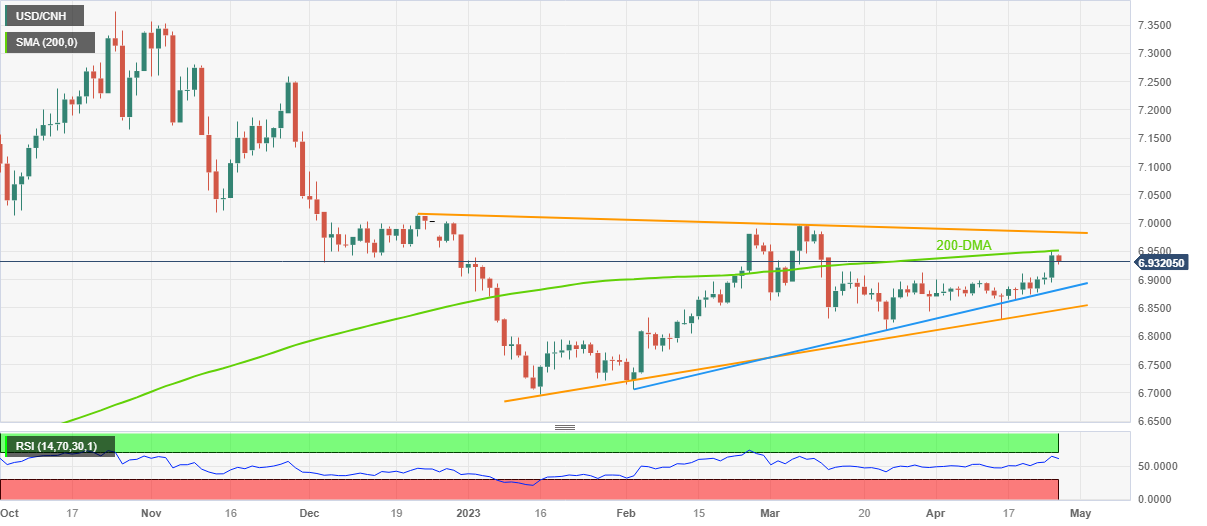
USD/CNH Price Analysis: Retreats from 200-DMA to snap three-day uptrend above 6.9300

  • USD/CNH prints the first daily loss in four as it eases from the highest levels in six weeks.
  • Key DMA, nearly overbought RSI (14) challenges further upside of the offshore Chinese Yuan (CNH) pair.
  • Four-month-old symmetrical triangle restricts short-term moves, ascending trend line from early February adds to downside filters.

USD/CNH drops towards 6.9300 while defying the three-day winning streak ahead of Wednesday’s European session, down 0.16% intraday to 6.9320 at the latest. In doing so, the offshore Chinese Yuan (CNH) pair reverses from its highest levels in 1.5 months.

That said, a failure to cross the 200-DMA triggered the USD/CNH pair’s pullback move. Adding strength to the retreat is the nearly overbought RSI (14) conditions.

As a result, the quote’s further declines towards an upward-sloping support line from February 02, close to 6.8820 at the latest, can’t be ruled out.

However, the bottom line of the four-month-old symmetrical triangle, between 6.9840 and 6.8465, appears strong hurdles for the USD/CNH pair traders to tackle before suggesting clear moves.

On the flip side, a daily closing beyond the 200-DMA level of 6.9520 could direct the USD/CNH bulls toward the stated triangle’s top line surrounding 6.9840.

It’s worth noting that the USD/CNH bulls need validation from the November 2022 bottom surrounding 7.0200 to retake control whereas multiple levels around the 6.8000 round figure can check the pair sellers past 6.8465.

Overall, USD/CNH is likely to remain within the multi-day-old symmetrical triangle.

USD/CNH: Daily chart

Trend: Limited downside expected

Additional important levels

Overview
Today last price6.9338
Today Daily Change-0.0092
Today Daily Change %-0.13%
Today daily open6.943
 
Trends
Daily SMA206.887
Daily SMA506.8963
Daily SMA1006.8777
Daily SMA2006.951
 
Levels
Previous Daily High6.9508
Previous Daily Low6.8948
Previous Weekly High6.9104
Previous Weekly Low6.8646
Previous Monthly High6.997
Previous Monthly Low6.8104
Daily Fibonacci 38.2%6.9295
Daily Fibonacci 61.8%6.9162
Daily Pivot Point S16.9082
Daily Pivot Point S26.8736
Daily Pivot Point S36.8522
Daily Pivot Point R16.9642
Daily Pivot Point R26.9856
Daily Pivot Point R37.0202

Author

Anil Panchal

Anil Panchal

FXStreet

Anil Panchal has nearly 15 years of experience in tracking financial markets. With a keen interest in macroeconomics, Anil aptly tracks global news/updates and stays well-informed about the global financial moves and their implications.

More from Anil Panchal
Share:

Editor's Picks

EUR/USD weakens below 1.1700 as Middle East tensions drive US Dollar strength

The EUR/USD pair trades with mild losses around 1.1685, the lowest since late January, during the early Asian session on Tuesday. The US Dollar gathers strength against the Euro as escalating tensions in the Middle East boost safe-haven currencies. The preliminary reading of the Harmonized Index of Consumer Prices from the Eurozone will be published later on Tuesday.  

GBP/USD hits new yearly lows near 1.3300

GBP/USD adds to the recent bearish tone, approaching to the key 1.3300 support to reach fresh YTD troughs against the backdrop of the robust performance of the US Dollar. Indeed, Cable’s decline comes amid the firm demand for the safe-haven space in the wake of the US and Israel attacks to Iran.

Gold defends bids as US-Iran war continues to fuel safe-haven flows

Gold retains positive bias for the fifth consecutive day on Tuesday as rising geopolitical tensions in the Middle East continue to underpin safe-haven assets. However, a bullish US Dollar keeps the bullion below its highest level since late January, set on Monday, warranting caution before positioning for any further appreciation.

Strategy lifts holdings to 3.4% of Bitcoin's total supply amid inflows into crypto products

Strategy continued its accumulation of the top crypto last week, acquiring 3,015 BTC for $204 million amid renewed interest in crypto products after four weeks of outflows.

The market is not panicking it is repricing the probability distribution of Oil and time

At the end of the day, markets do not trade morality or geopolitics. They trade transmission channels. And the only channel that truly matters in this maelstrom runs through the price of energy and the time value of money.

Grass 20% bullish breakout defies broader market weakness

Grass (GRASS) is edging up above $0.30 at the time of writing on Monday. The token’s notable 20% intraday surge stands out amid heightened volatility in the broader crypto market.