|

USD/CNH Price Analysis: Extends downside break of 100-DMA towards monthly low

  • USD/CNH prints three-day downtrend, bears attack weekly bottom.
  • Descending RSI line, not oversold, joins SMA breakdown to back the sellers.
  • Convergence of six-week-old support line, 61.8% Fibonacci retracement becomes a tough nut to crack for bears.

USD/CNH takes offers around 6.4400, down 0.17% intraday during the three-day fall ahead of Friday’s European session. In doing so, the offshore Chinese currency (CNH) pair stretches the latest failures to stay past 100-DMA.

Given the descending RSI line joining the weaker prices despite being not oversold, USD/CNH is likely to remain pressured towards the monthly low, also the lowest since June 17, around 6.4245.

However, a clear downside break of 50% Fibonacci retracement of the May-July upside, close to 6.4400, becomes necessary to strengthen the bearish impulse.

Should the quote remains weak past 6.4245, a confluence of a six-week-old falling trend line and 61.8% Fibonacci retracement near 6.4200 will be the key to watch.

Meanwhile, recovery moves need to cross the 100-DMA level of 6.4540 to recall the short-term buyers and direct them to the monthly peak of 6.4650.

Following that, 23.6% Fibonacci retracement level and a multi-day-old falling trend line, respectively around 6.4870 and 6.4955, will be the key figures to watch before confirming any further upside.

USD/CNH: Daily chart

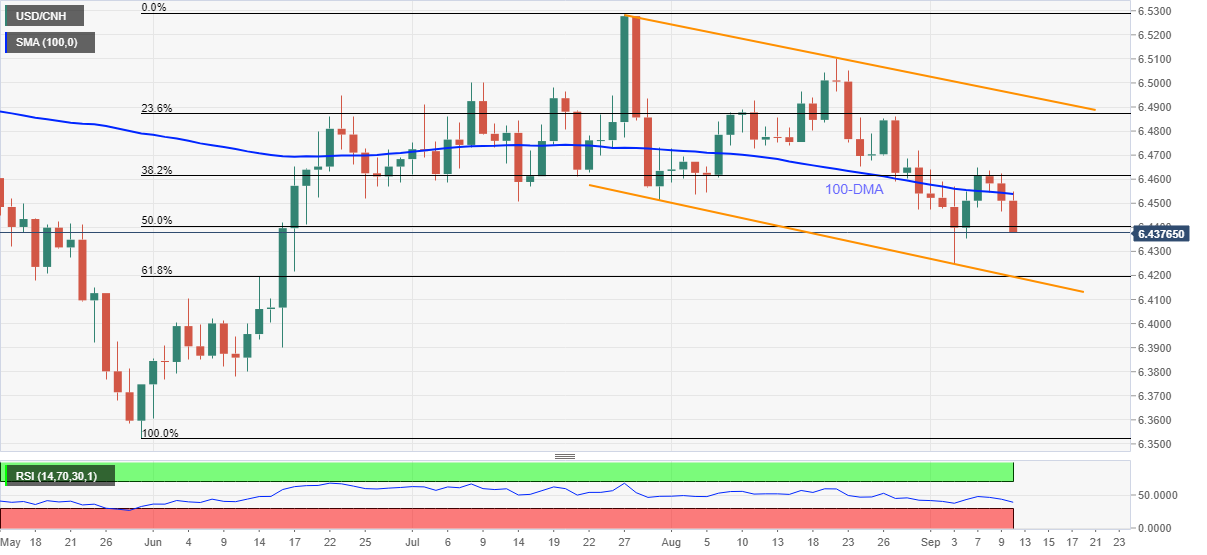
Trend: Further weakness expected

Additional important levels

Overview
Today last price6.4406
Today Daily Change-0.0105
Today Daily Change %-0.16%
Today daily open6.4511
 
Trends
Daily SMA206.4688
Daily SMA506.4732
Daily SMA1006.4543
Daily SMA2006.476
 
Levels
Previous Daily High6.4624
Previous Daily Low6.4464
Previous Weekly High6.472
Previous Weekly Low6.4244
Previous Monthly High6.5102
Previous Monthly Low6.4473
Daily Fibonacci 38.2%6.4525
Daily Fibonacci 61.8%6.4563
Daily Pivot Point S16.4442
Daily Pivot Point S26.4374
Daily Pivot Point S36.4283
Daily Pivot Point R16.4601
Daily Pivot Point R26.4692
Daily Pivot Point R36.476

Author

Anil Panchal

Anil Panchal

FXStreet

Anil Panchal has nearly 15 years of experience in tracking financial markets. With a keen interest in macroeconomics, Anil aptly tracks global news/updates and stays well-informed about the global financial moves and their implications.

More from Anil Panchal
Share:

Editor's Picks

EUR/USD eases marginally, back to 1.1800

EUR/USD navigates a narrow range on Thursday, hovering around the 1.1800 neighbourhood in a context of humble gains in the US Dollar. The pair’s lacklustre performance come amid the unabated trade uncertainty, geopolitical tensions in the Middle East and the cautious tone from the ECB’s Lagarde.

GBP/USD retreats from tops, approaching 1.3540

GBP/USD partially sets aside Wednesday’s strong advance and recedes to the 1.3540 region on Thursday. Cable’s modest retracement follows the equally acceptable gains in the Greenback, while investors continue to pencil in a potential BoE rate cut in March.

Gold clings to gains just below $5,200, focus on geopolitics

Gold is edging modestly higher on Thursday, adding to Wednesday’s uptick and holding just below the $5,200 mark per troy ounce against the backdrop of modest gains in the US Dollar. In the meantime, attention is turning to the geopolitical scenario following US-Iran nuclear talks.

Stellar: Relief bounce fades as bearish undertone persists

Stellar is trading around $0.16 at the time of writing on Thursday after rebounding more than 8% in the previous day. Derivatives data paints a negative picture as XLM’s short bets hit a monthly high while Open Interest continues to decline.

The one thing everyone is on the lookout for is US action of some sort against Iran

The FX market is minestrone soup these days. It is befuddled by conflicting data, rumors and small stories exaggerated out of proportion, and Trump-generated uncertainty. 

Solana strikes key resistance with double-digit gains

Solana trades at $88 at press time on Thursday, after an 11% upswing the previous day within a broader consolidation range of roughly three weeks. Institutional demand for Solana heightens as US spot SOL Exchange Traded Funds record $30 million of inflow on Wednesday.