|

USD/CNH Price Analysis: Edges lower to near 7.2100 followed by support at 23.6% Fibonacci

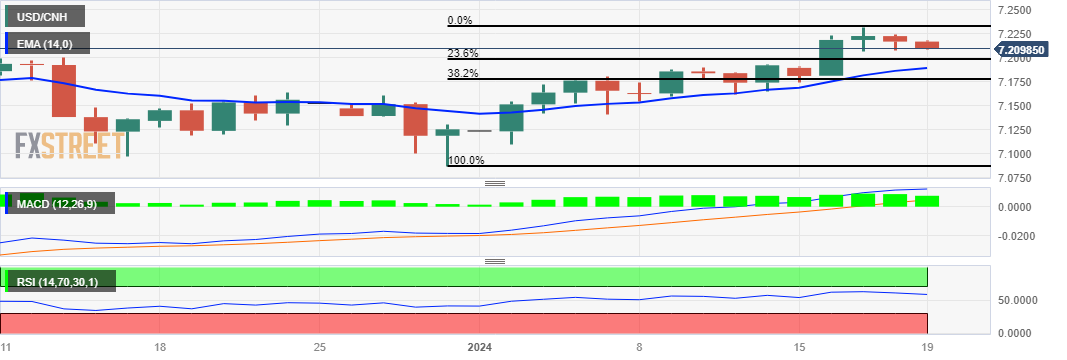
  • USD/CNH extends its losses followed by the support at 23.6% Fibonacci retracement level at 7.1985.
  • A break below the 14-day EMA could lead the pair to test the weekly low at 7.1748.
  • Technical indicators suggest a bullish momentum to revisit the week’s high at 7.2322.

USD/CNH extends its losses for the second successive session, trading lower near the 7.2100 psychological level during the Asian session on Friday. The People's Bank of China (PBoC) has consistently set the reference rate at levels lower than what modeled estimates suggest. Additionally, strategic moves have been made to bolster the offshore Yuan (CNH) by selling the US Dollar (USD) in the open market.

The 23.6% Fibonacci retracement level at 7.1985 acts as an immediate support followed by the 14-day Exponential Moving Average (EMA) at 7.1899. A firm break below the 14-day EMA could put downward pressure on the USD/CNH pair to navigate the support region around the 38.2% Fibonacci retracement level at 7.1772 aligned with the week’s low at 7.1748.

The technical analysis of the Moving Average Convergence Divergence (MACD) for the USD/CNH pair reveals a bullish outlook. The MACD line is situated above the centerline and displays divergence above the signal line. This configuration suggests a potential uptrend in the market. With this bullish sentiment, there is a possibility that the pair may revisit the week's high at 7.2322.

Furthermore, the 14-day Relative Strength Index (RSI), a lagging indicator, is positioned above the 50 mark. This suggests a confirmation of stronger momentum for the USD/CNH pair. With this increased momentum, there is potential for the bulls to strengthen their position, potentially surpassing the week's high and exploring levels around the psychological mark at 7.2500.

USD/CAD: Daily Chart

USD/CNH: additional technical levels

Overview
Today last price7.2134
Today Daily Change-0.0036
Today Daily Change %-0.05
Today daily open7.217
 
Trends
Daily SMA207.1684
Daily SMA507.1726
Daily SMA1007.2409
Daily SMA2007.1853
 
Levels
Previous Daily High7.2242
Previous Daily Low7.2078
Previous Weekly High7.193
Previous Weekly Low7.1544
Previous Monthly High7.2
Previous Monthly Low7.0874
Daily Fibonacci 38.2%7.2141
Daily Fibonacci 61.8%7.2179
Daily Pivot Point S17.2084
Daily Pivot Point S27.1998
Daily Pivot Point S37.192
Daily Pivot Point R17.2249
Daily Pivot Point R27.2328
Daily Pivot Point R37.2414

Author

Akhtar Faruqui

Akhtar Faruqui is a Forex Analyst based in New Delhi, India. With a keen eye for market trends and a passion for dissecting complex financial dynamics, he is dedicated to delivering accurate and insightful Forex news and analysis.

More from Akhtar Faruqui
Share:

Editor's Picks

EUR/USD edges lower below 1.1650 as Middle East tensions fuel US Dollar strength

The EUR/USD pair trades in negative territory around 1.1635 during the early Asian session on Thursday. The US Dollar strengthens against the Euro as escalating Middle East conflict boosts safe-haven flows. Traders brace for the Eurozone Retail Sales and US weekly Initial Jobless Claims reports, which will be released later on Thursday. 

GBP/USD tests key moving averages as growth downgrade weighs

GBP/USD was nearly flat on Wednesday, edging up 0.08% to settle around 1.3370 in a quiet session. The pair has fallen sharply from its late-January high near 1.3870 and is now testing the 200-day Exponential Moving Average, with this week's one-week forex heatmap showing Pound Sterling as one of the worst performers against the US Dollar, down about 1.4% on the week.

Gold re-attempts $5,200 amid a softer USD; reduced Fed rate cut bets cap gains

Gold bounces toward $5,200 for the second consecutive day on Thursday amid a modest US Dollar weakness. Wednesday's upbeat US macro data further tempered hopes for three rate cuts by the Fed in 2026. Furthermore, escalating Middle East tensions might continue to benefit the USD's status as the global reserve currency and contribute to capping the bullion.

Ethereum jumps alongside a spike in open interest, realized price could limit upside

Ethereum has jumped above $2,100 on Wednesday, following a general recovery across the crypto market. The move was accompanied by a spike in Ethereum's open interest, which has increased to 13.43M ETH — its highest level since January 31. 

First Venezuela, now Iran: The US-China energy war escalates

At first glance, the latest escalation involving the United States with both Iran and Venezuela looks like another chapter in a long-running geopolitical story. But viewed through a broader strategic lens, something else may be unfolding: Energy.

Bittensor extends recovery despite retail demand slump

Bittensor, a leading Artificial Intelligence token, is aging up above $190 at the time of writing on Wednesday. Steady price increases characterise the broader crypto market, with Bitcoin holding above $71,000 and Ethereum above $2,000.