|

USD/CNH Price Analysis: Confirms rising wedge on H1

  • USD/CNH consolidates previous day’s rebound, confirms bearish chart pattern.
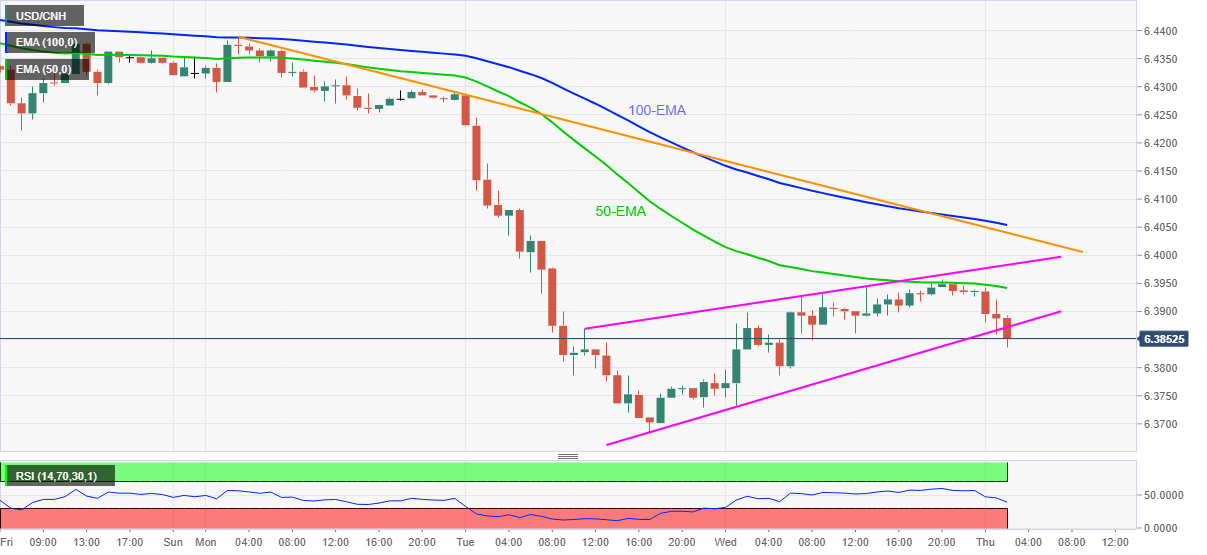
  • 50-EMA guards immediate upside, convergence of 100-EMA, weekly resistance line becomes the key hurdle.

USD/CNH takes offers to $6.3850, confirming the bearish chart formation during early Thursday. In doing so, the Chinese currency (CNH) pair reverses the previous day’s rebound from the lowest since June.

Given the RSI line having a buffer before hitting the oversold territory, coupled with the rising wedge breakdown, USD/CNH may extend the latest south-run toward the recent multi-day low near $6.3685.

It’s worth noting that the yearly low surrounding $6.3525 will challenge the pair bears afterward, failing to do so can recall the year 2018 bottom close to $6.2360.

Meanwhile, 50-EMA near $6.3940 restricts corrective pullback ahead of the $6.4050-55 resistance confluence, including 100-EMA and a descending trend line from October 18.

Overall, USD/CNH remains in the bearish trajectory and the latest confirmation of the rising wedge adds strength to the seller’s view.

USD/CNH: Hourly chart

Trend: Further weakness expected

Additional important levels

Overview
Today last price6.388
Today Daily Change-0.0068
Today Daily Change %-0.11%
Today daily open6.3948
 
Trends
Daily SMA206.4438
Daily SMA506.4568
Daily SMA1006.4579
Daily SMA2006.4677
 
Levels
Previous Daily High6.3956
Previous Daily Low6.3728
Previous Weekly High6.4644
Previous Weekly Low6.4222
Previous Monthly High6.488
Previous Monthly Low6.4244
Daily Fibonacci 38.2%6.3869
Daily Fibonacci 61.8%6.3816
Daily Pivot Point S16.3799
Daily Pivot Point S26.365
Daily Pivot Point S36.3571
Daily Pivot Point R16.4027
Daily Pivot Point R26.4106
Daily Pivot Point R36.4255

Author

Anil Panchal

Anil Panchal

FXStreet

Anil Panchal has nearly 15 years of experience in tracking financial markets. With a keen interest in macroeconomics, Anil aptly tracks global news/updates and stays well-informed about the global financial moves and their implications.

More from Anil Panchal
Share:

Editor's Picks

EUR/USD looks apathetic around 1.1770

EUR/USD comes under renewed pressure on Tuesday, deflating below the 1.1800 support and reversing two consecutive days of gains. The pair’s decline follows the persistent move higher in the US Dollar, as trade uncertainty dominates the sentiment ahead of President Trump’s SOTU speech.

GBP/USD regains 1.3500 and above

GBP/USD extends its advance for the third day in a row on Tuesday, this time retesting the area beyond the 1.3500 hurdle. Cable’s uptick comes despite decent gains in the Greenback and the dovish message from the BoE’s Bailey at the UK Parliament.

Gold appears offered around $5,150

Gold is giving back a good portion of the recent multi-day rally, receding to the $5,150 zone per troy ounce amid the decent bounce in the US Dollar and mixed US Treasuty yields. In the meantime, markets’ attention remain on upcoming comments from Fed speakers.

Crypto Today: Bitcoin, Ethereum, XRP come under renewed pressure amid ETF outflows, tariff uncertainty

Bitcoin, Ethereum and Ripple are trading under increasing selling pressure at the time of writing on Tuesday, as market participants navigate renewed tariff uncertainty. The Crypto King holds above $63,000, down 2% intraday from its $64,656 open.

The Citrini report: How a debatable AI narrative can shake Wall Street

That AI-related headline alone was enough to rattle investors.US stocks slid sharply on Monday after a widely circulated Citrini Research memo outlined a hypothetical “2028 Global Intelligence Crisis”, warning that rapid AI adoption could push US unemployment into double digits as early as by mid-2028.

XRP pressured by weak ETF flows and declining retail interest

Ripple (XRP) is edging lower, trading above its intraday low of $1.32 at the time of writing on Tuesday. The decline from its weekly opening of $1.39 reflects heightened volatility in the broader cryptocurrency market, accentuated by tariff-triggered uncertainty.