USD/CHF Technical Analysis: Make-or-break for the Swissy

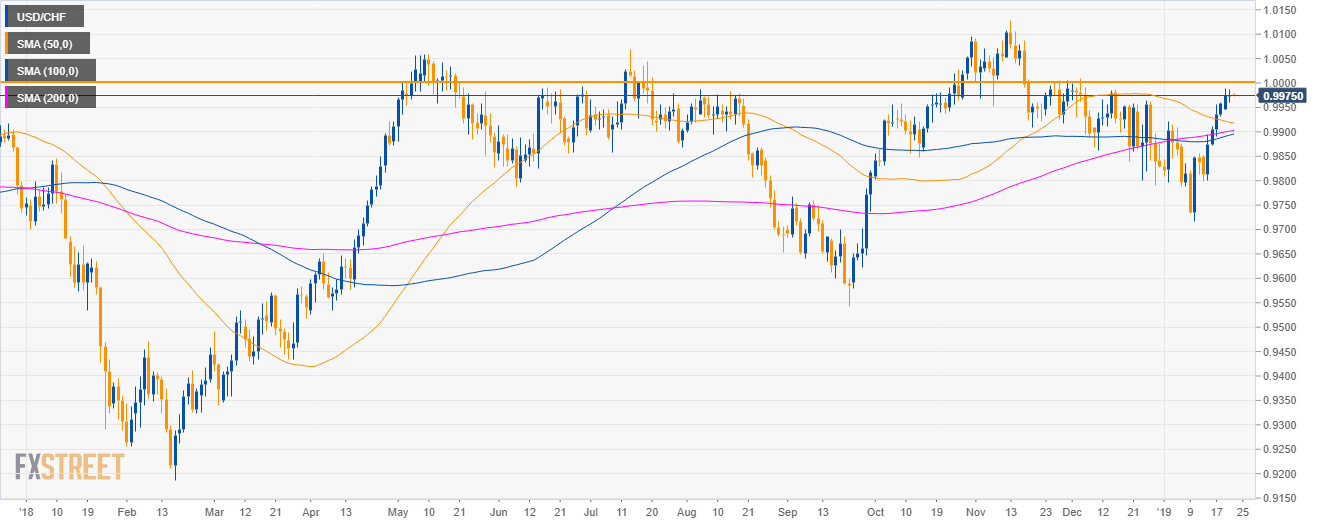
USD/CHF daily chart
- USD/CHF is trading in a bullish leg above the main simple moving averages (SMAs).
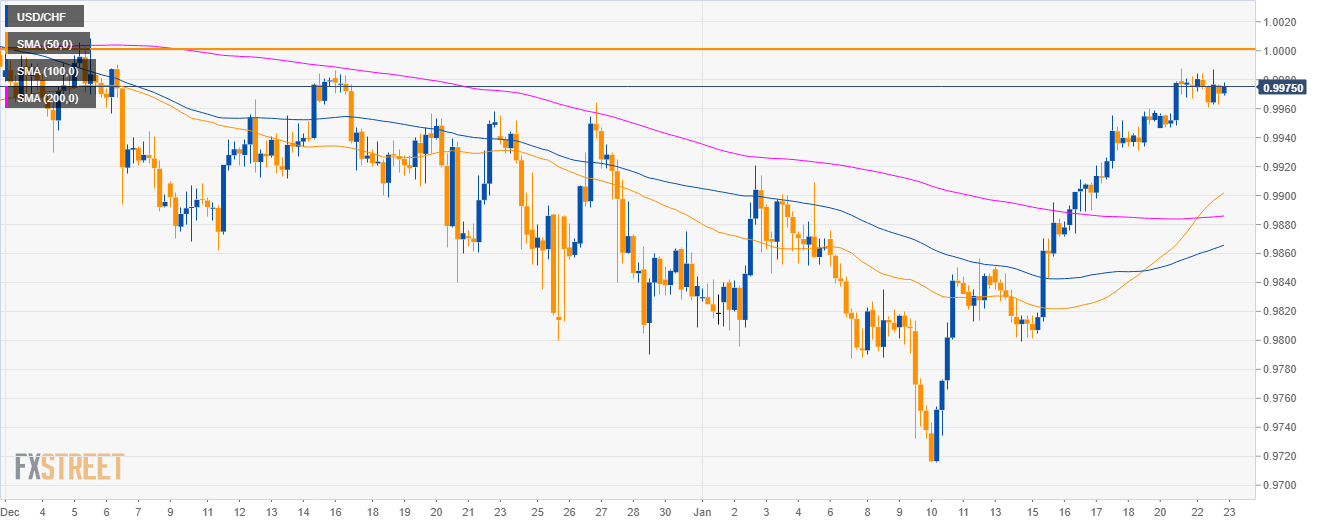
USD/CHF 4-hour chart
- USD/CHF is trading above the main SMAs as the market is trading just below the parity level.
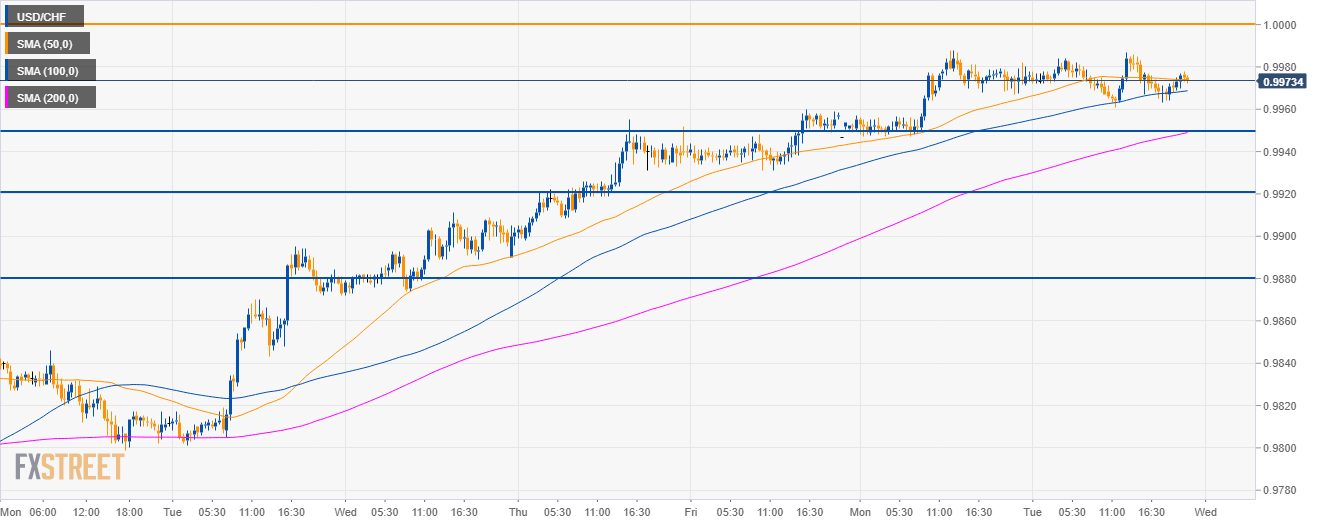
USD/CHF 30-minute chart
- This is a make-or-break situation for both bulls and bears as bulls would need a break above the parity level to extend the bull trend.
- A break above 1.0000 would lead to an acceleration to the 1.0030 level.
- On the flip side, failure to break above 1.0000 would trigger bears to target the 0.9950, 0.9920 and 0.9880 levels.
Additional key levels
NZD/USD
Overview:
Today Last Price: 0.6722
Today Daily change: - 7 pips
Today Daily change %: -0.10%
Today Daily Open: 0.6729
Trends:
Daily SMA20: 0.6747
Daily SMA50: 0.6797
Daily SMA100: 0.6689
Daily SMA200: 0.678
Levels:
Previous Daily High: 0.6756
Previous Daily Low: 0.6713
Previous Weekly High: 0.685
Previous Weekly Low: 0.6727
Previous Monthly High: 0.697
Previous Monthly Low: 0.6686
Daily Fibonacci 38.2%: 0.6729
Daily Fibonacci 61.8%: 0.674
Daily Pivot Point S1: 0.6709
Daily Pivot Point S2: 0.669
Daily Pivot Point S3: 0.6666
Daily Pivot Point R1: 0.6752
Daily Pivot Point R2: 0.6775
Daily Pivot Point R3: 0.6795
Author

Flavio Tosti
Independent Analyst


