|

USD/CHF Price Prediction: Potential for a pull back within a new uptrend

  • USD/CHF has formed a new uptrend after reversing higher following the August 29 low. 
  • The RSI has exited overbought, indicating a risk of a pull back developing within the uptrend. 

USD/CHF has been recovering since bottoming out at the August 29 lows. The pair kicked off the uptrend with a bullish Three White Soldiers Japanese candlestick pattern right after the August 29 bottom. This occurs when three green candlesticks of a similar size follow a new low. 

USD/CHF has probably now started a new uptrend and since “the trend is your friend” the odds favor more upside.

USD/CHF 4-hour Chart 

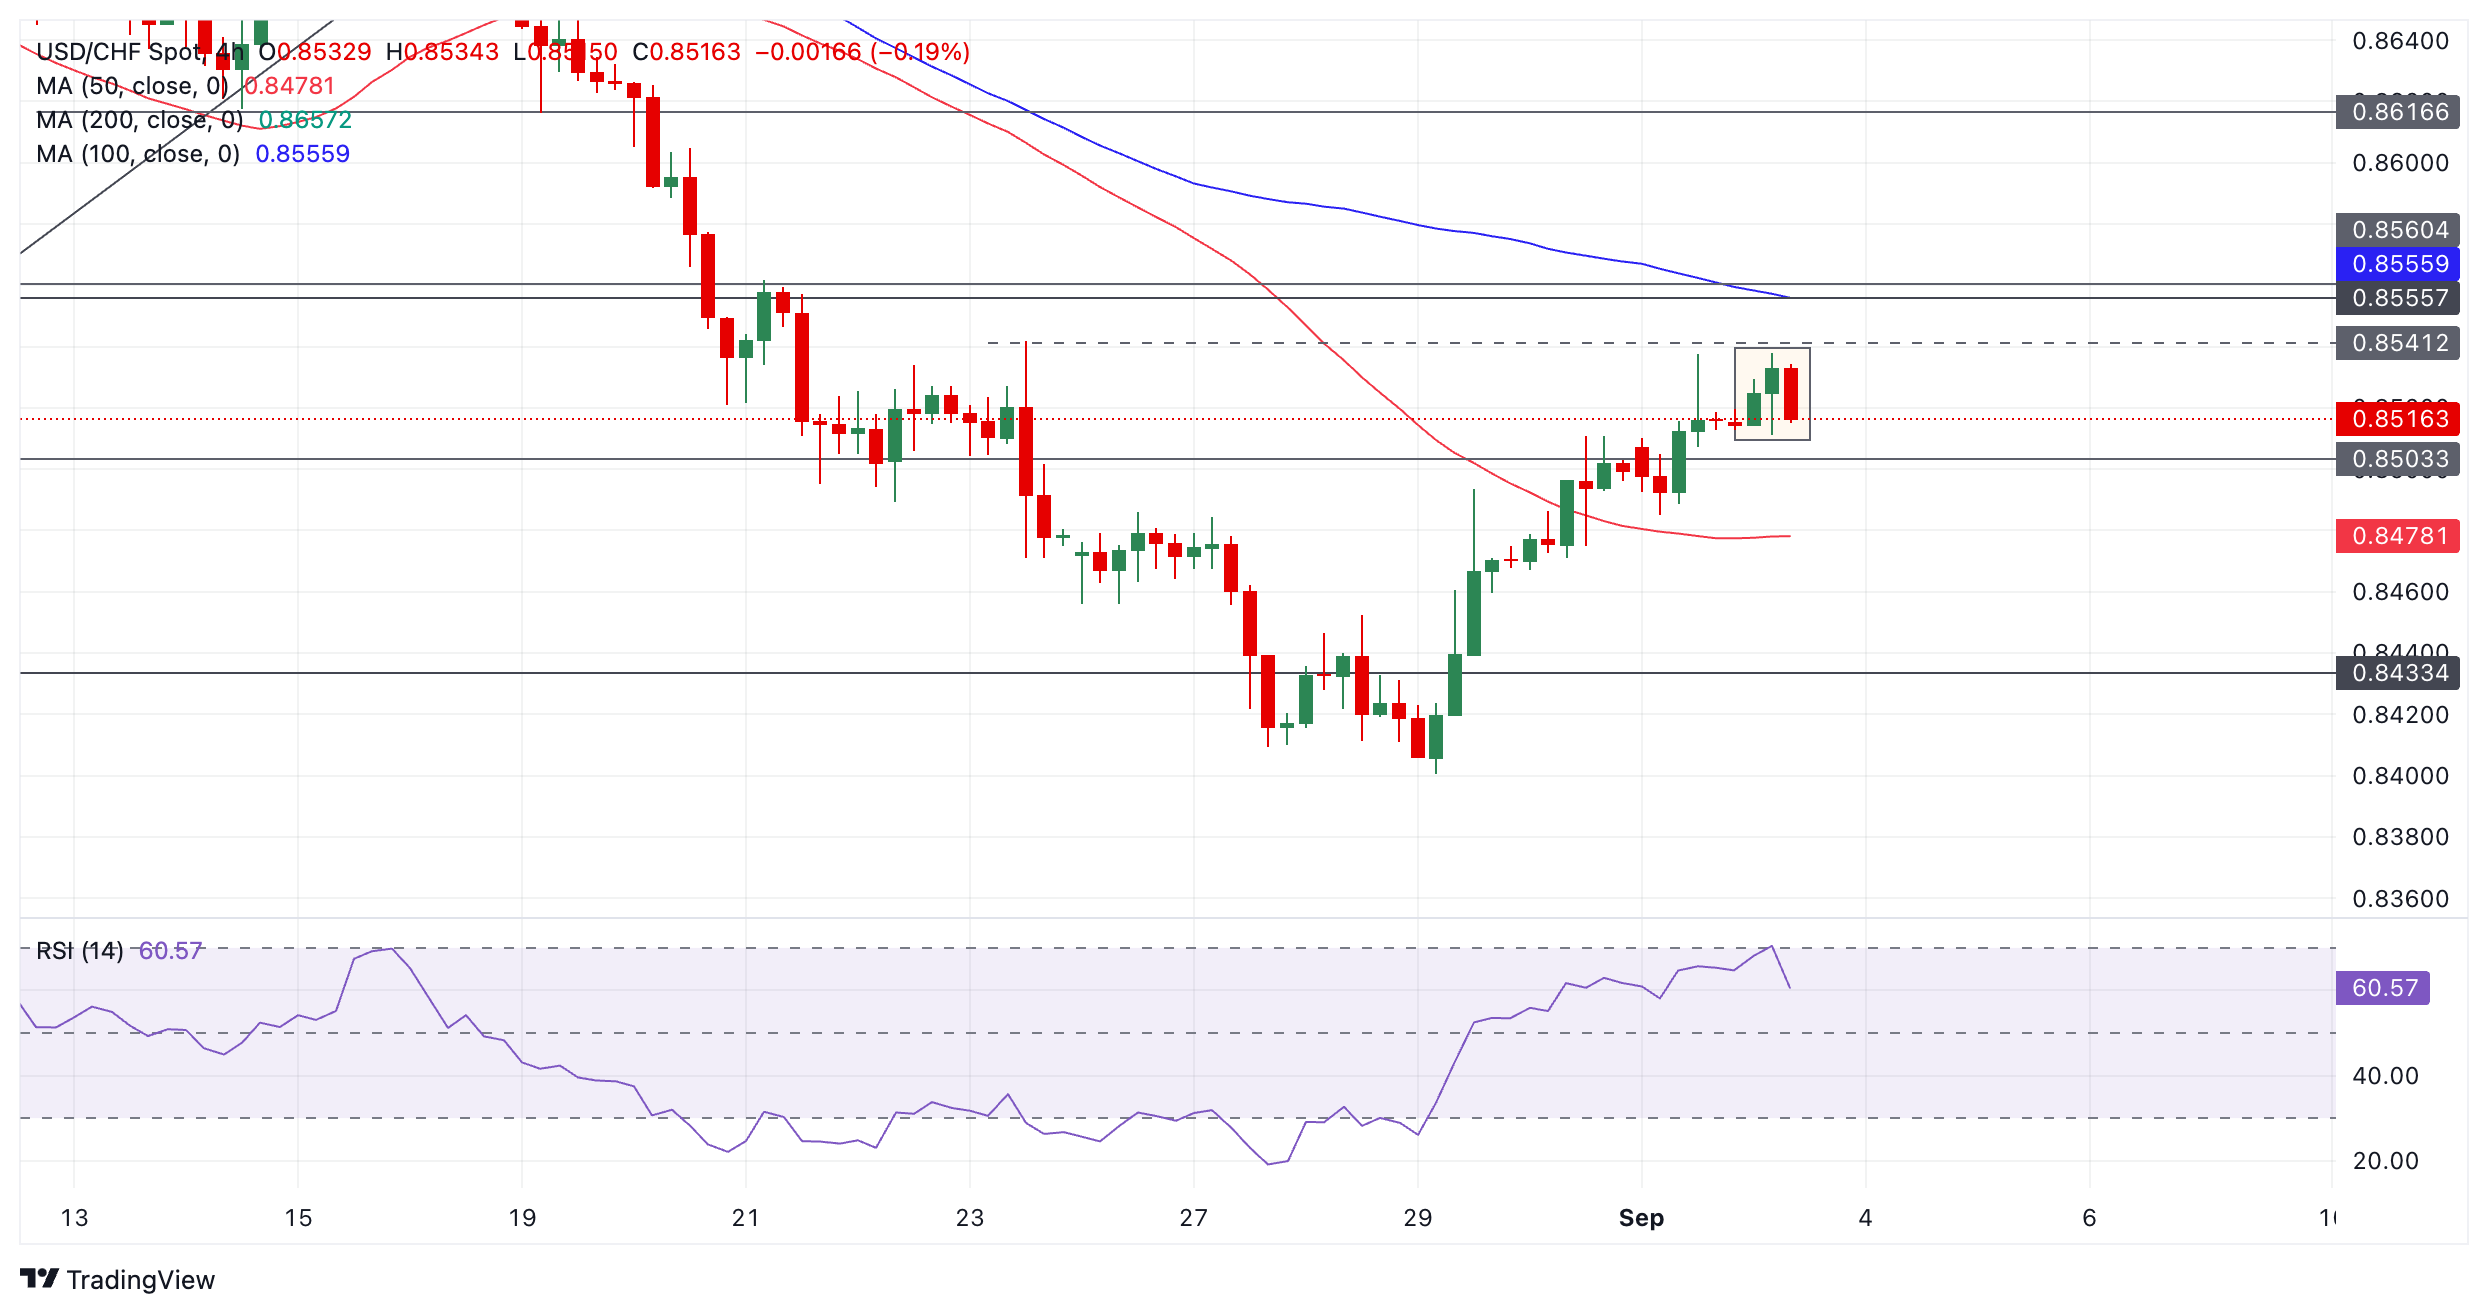
There is a risk USD/CHF could temporarily pull back before it continues higher, however, as the Relative Strength Index (RSI) momentum indicator has just exited overbought territory. This provides a signal that the trend is likely to correct or reverse. 

The RSI exiting overbought was accompanied by the formation of a bearish Hanging Man Japanese candlestick pattern (shaded rectangle). The current candle is red and looking like it will probably end as a down candle, adding confirmation to the Hanging Man. 

If a correction unfolds it will probably pull back down to support at either 0.8503 or 0.8485. 

The dominant short-term uptrend is likely to eventually resume, however, and take the price back up. A break above 0.8541 (August 23 high) would see resistance at 0.8557 come into view, followed by 0.8617 if the uptrend proves strong.

Author

Joaquin Monfort

Joaquin Monfort is a financial writer and analyst with over 10 years experience writing about financial markets and alt data. He holds a degree in Anthropology from London University and a Diploma in Technical analysis.

More from Joaquin Monfort
Share:

Editor's Picks

EUR/USD treads water around 1.1900

EUR/USD edges a tad lower around the 1.1900 area, coming under mild pressure despite the US Dollar keeps the offered stance on turnaround Tuesday. On the US data front, December Retail Sales fell short of expectations, while the ADP four week average printed at 6.5K.

GBP/USD looks weak near 1.3670

GBP/USD trades on the back foot around the 1.3670 region on Tuesday. Cable’s modest retracement also comes in tandem with the decent decline in the Greenback. Moving forward, the US NFP and CPI data in combination with key UK releases should kee the quid under scrutiny in the next few days.

Gold flirts with daily lows near $5,000

Gold comes under marked selling pressure on Tuesday, giving back part of its recent two day advance and threatening to challenge the key $5,000 mark per troy ounce. The yellow metal’s correction follows a better tone in the risk complex, a lower Greenback and shrinking US Treasuty yields.

AI Crypto Update: BankrCoin, Pippin surge as sector market cap steadies above $12B

The Artificial Intelligence (AI) segment is largely on the back foot with major coins such as Bittensor (TAO) and Internet Computer (ICP) extending losses amid a sticky risk-off sentiment.

Dollar drops and stocks rally: The week of reckoning for US economic data

Following a sizeable move lower in US technology Stocks last week, we have witnessed a meaningful recovery unfold. The USD Index is in a concerning position; the monthly price continues to hold the south channel support.

XRP holds $1.40 amid ETF inflows and stable derivatives market

Ripple trades under pressure, with immediate support at $1.40 holding at the time of writing on Tuesday. A recovery attempt from last week’s sell-off to $1.12 stalled at $1.54 on Friday, leading to limited price action between the current support and the resistance.