|

USD/CHF Price Prediction: Head and Shoulders hints at further declines

  • USD/CHF has formed a bearish H&S pattern which hints at more weakness. 
  • More downside will be confirmed by a break below the base of the pattern or its “neckline”. 

USD/CHF has likely formed a bearish Head and Shoulders (H&S) reversal pattern on the 4-hour chart, which, if valid, indicates a probable decline is on the cards for the pair. 

USD/CHF 4-hour Chart 

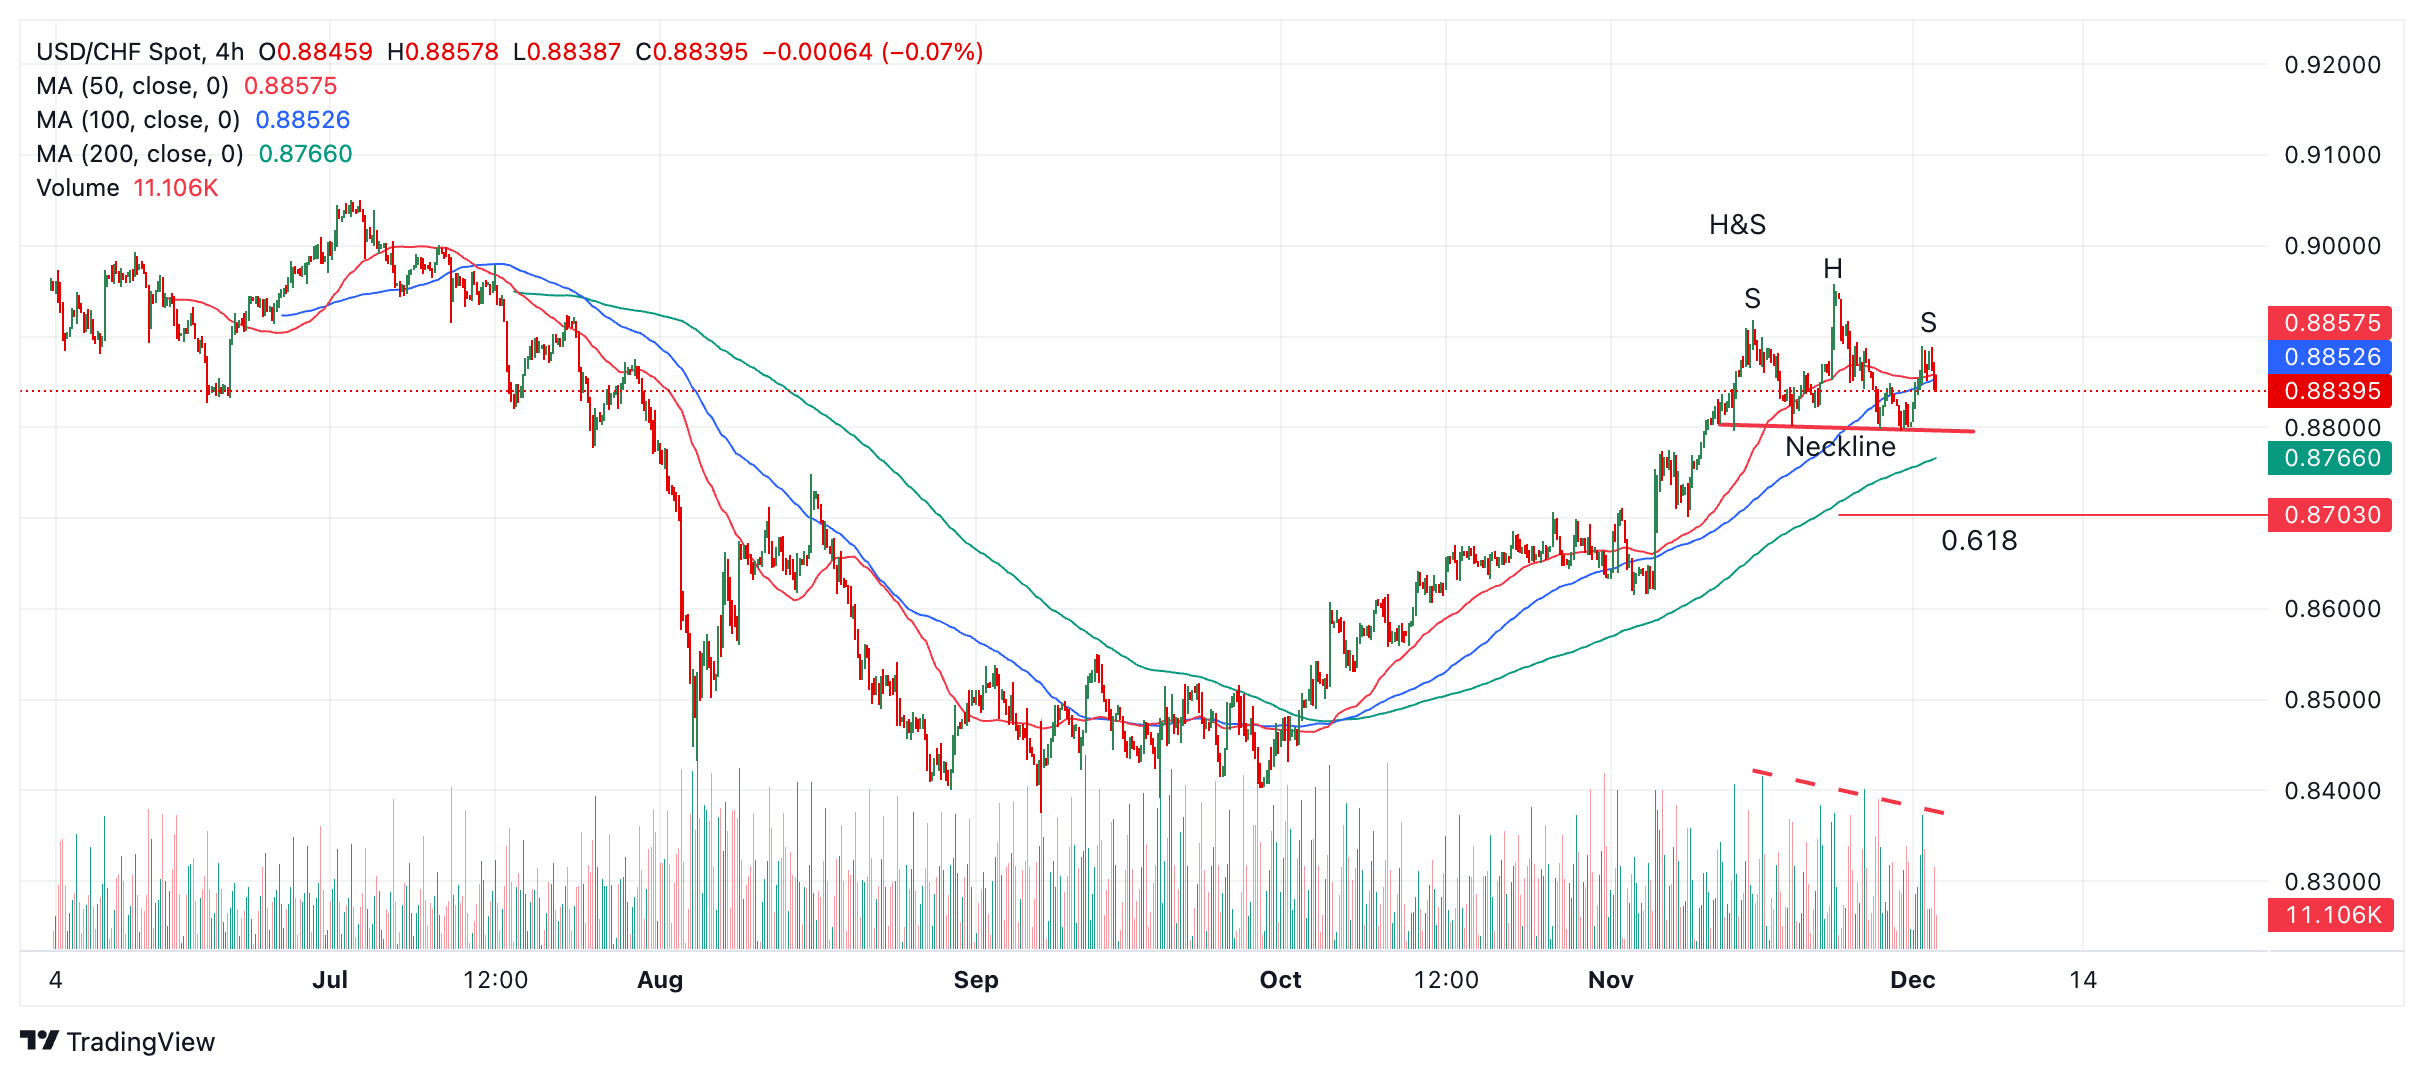
The H&S is composed of a peak, the “head” (H) and two shoulders either side (S). A break below the neckline at the base of the pattern confirms a decline lower. The pattern is a bearish reversal sign. 

On USD/CHF the neckline is at around 0.8797. The initial target for the pattern is at 0.8703, the 61.8% Fibonacci extension of the height of the pattern extrapolated lower (red line labelled 0.618 on chart). 

Volume has declined during the formation of the H&S (red dashed line), further enhancing the validity of the pattern. 

Author

Joaquin Monfort

Joaquin Monfort is a financial writer and analyst with over 10 years experience writing about financial markets and alt data. He holds a degree in Anthropology from London University and a Diploma in Technical analysis.

More from Joaquin Monfort
Share:

Editor's Picks

EUR/USD recovers further from one-month low set on Friday, eyes mid-1.1800s on weaker USD

The EUR/USD pair is seen building on Friday's late recovery from the 1.1750-1.1740 region, or a nearly one-month trough, and gaining some follow-through positive traction at the start of a new week. The momentum lifts spot prices to the 1.1835 area during the Asian session and is sponsored by a broadly weaker US Dollar.

GBP/USD gathers strength above 1.3500 amid tariff confusion

The GBP/USD pair gains traction to around 1.3520 during the early Asian session on Monday. The US Dollar faces some selling pressure against the Cable as tariff uncertainty lingers. Traders will take more cues from the US Producer Price Index report for January, which will be published later on Friday. 

Gold rallies above $5,150 as Trump’s tariffs boost haven demand

Gold price extends the rally above $5,150 in the Asian session on Monday. The precious metal extends the rally amid US President Donald Trump’s tariff threats and uncertainty, which boost safe-haven flows. US-Iran geopolitical risks also linger, supporting the Gold price upside. 

Week ahead: Markets brace for heightened volatility as event risk dominates

Dollar strength dominates markets as risk appetite remains subdued. A Supreme Court ruling, geopolitics and Fed developments are in focus. Pivotal Nvidia earnings on Wednesday as investors question tech sector weakness. Yen and aussie diverge; both pound and euro could recoup their losses.

Liberation day take two, the tariff machine just changed gears

Let me caveat this from the outset. What we are watching is first-order mechanics, not the grand macro endgame. This is the market’s immediate reflex to a 15% Trump tariff levy dressed up as judicial drama. The Supreme Court blocked Trump tarrif hammer. The White House came back with a scalpel.

Ripple bulls defend key support amid waning retail demand and ETF inflows

XRP ticks up above $1.40 support, but waning retail demand suggests caution. XRP attracts $4 million in spot ETF inflows on Thursday, signaling renewed institutional investor interest.