• US prices paid by producers show signs of easing, except for the core PPI.
  • Core inflation in the US is showing signs of being stickier than estimated.
  • USD/CHF Price Analysis: Break above 0.9630 puts the 0.9700 figure in play; otherwise, a fall toward 0.9420 is on the cards.

The USD/CHF is trading sideways after rising 0.82% on Tuesday as a reaction to US inflation data showing signs that it’s easing in plain vanilla CPI. Still, core inflation is edging higher on the consumer and producer side, as the US Department of Labor reported. Therefore, the USD/CHF remained almost unchanged but slightly down 0.01%, trading at 0.9613.

USD/CHF Price Analysis: Technical outlook

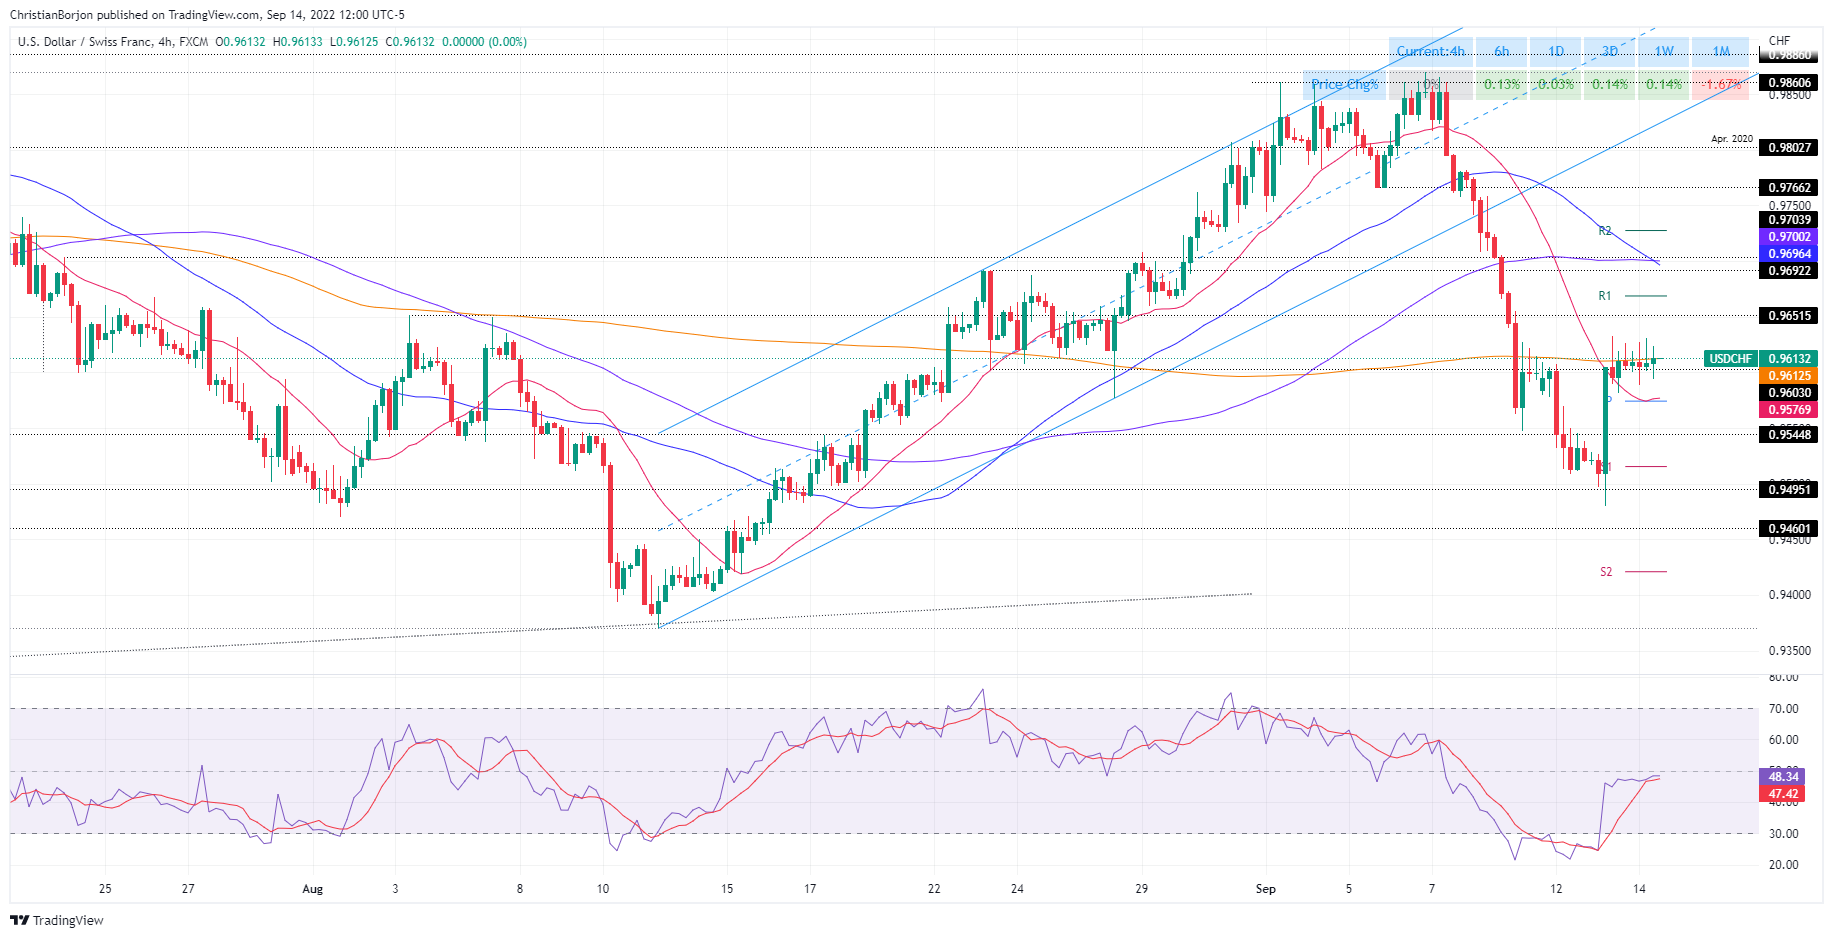
On Wednesday, the USD/CHF daily chart depicts the pair as neutral-to-downward biased, and it’s worth noting that earlier, the major tested the weekly high at around 0.9633, but broad US dollar weakness put a lid on higher USD/CHF prices.

Meanwhile, the USD/CHF four-hour scale illustrates the pair consolidating above the 20-EMA and the daily pivot point, each at 0.9576 and 0.9574, respectively. Additionally, the 200-EMA at 0.9612 is acting as resistance, keeping the USD/CHF prices subdued and unable to break the daily high at 0.9630.

A clear break above the 200-EMA would open the door for a test of Wednesday’s high at 0.9630, which, once cleared, the major could rally to the R1 pivot point at 0.9668. The break above would expose the confluence of the 50 and 100-EMAs at 0.9700.

On the flip side, the USD/CHF first support would be the confluence of the 20-EMA and the central pivot at 0.9574-76. A breach of the latter will expose the S1 pivot at 0.9515, followed by the September 13 low at 0.9479, followed by the S2 pivot point at 0.9421.

USD/CHF Key Technical Levels

USD/CHF

Overview
Today last price 0.9613
Today Daily Change -0.0010
Today Daily Change % -0.10
Today daily open 0.9616
 
Trends
Daily SMA20 0.968
Daily SMA50 0.9648
Daily SMA100 0.9693
Daily SMA200 0.9478
 
Levels
Previous Daily High 0.9634
Previous Daily Low 0.948
Previous Weekly High 0.987
Previous Weekly Low 0.9547
Previous Monthly High 0.9808
Previous Monthly Low 0.9371
Daily Fibonacci 38.2% 0.9575
Daily Fibonacci 61.8% 0.9538
Daily Pivot Point S1 0.9519
Daily Pivot Point S2 0.9422
Daily Pivot Point S3 0.9365
Daily Pivot Point R1 0.9673
Daily Pivot Point R2 0.973
Daily Pivot Point R3 0.9827


Share: Feed news

Information on these pages contains forward-looking statements that involve risks and uncertainties. Markets and instruments profiled on this page are for informational purposes only and should not in any way come across as a recommendation to buy or sell in these assets. You should do your own thorough research before making any investment decisions. FXStreet does not in any way guarantee that this information is free from mistakes, errors, or material misstatements. It also does not guarantee that this information is of a timely nature. Investing in Open Markets involves a great deal of risk, including the loss of all or a portion of your investment, as well as emotional distress. All risks, losses and costs associated with investing, including total loss of principal, are your responsibility. The views and opinions expressed in this article are those of the authors and do not necessarily reflect the official policy or position of FXStreet nor its advertisers. The author will not be held responsible for information that is found at the end of links posted on this page.

If not otherwise explicitly mentioned in the body of the article, at the time of writing, the author has no position in any stock mentioned in this article and no business relationship with any company mentioned. The author has not received compensation for writing this article, other than from FXStreet.

FXStreet and the author do not provide personalized recommendations. The author makes no representations as to the accuracy, completeness, or suitability of this information. FXStreet and the author will not be liable for any errors, omissions or any losses, injuries or damages arising from this information and its display or use. Errors and omissions excepted.

The author and FXStreet are not registered investment advisors and nothing in this article is intended to be investment advice.

Open Account
Open Account
Open Account
Open Account
Open Account
Open Account

Recommended content


Recommended content

Editors’ Picks

AUD/USD: Bulls need to clear 0.6540

AUD/USD: Bulls need to clear 0.6540

AUD/USD reversed part of Monday’s optimism and came all the way down to revisit the 0.6450 region, where its critical 200-day SMA also sits. The marked daily pullback in the pair followed the solid rebound in the US Dollar despite steady concerns on the trade front.

EUR/USD: Tough resistance emerges around 1.1450

EUR/USD: Tough resistance emerges around 1.1450

EUR/USD gave away most of the gains recorded at the beginning of the week, coming back to the area below the 1.1400 support on the back of the resurgence of the bid bias in the Greenback. Market participants will now shift their attention to the upcoming data releases in the US labour market.

Gold holds on to higher ground around $3,350

Gold holds on to higher ground around $3,350

Gold is falling from its multi-week high of over $3,400 achieved on Monday. It is currently losing further momentum and flirting with the $3,350 region per troy ounce on the back of a strong Greenback, higher yields and mixed US data.

Ripple Price Prediction: XRP could stage massive recovery amid growing institutional adoption

Ripple Price Prediction: XRP could stage massive recovery amid growing institutional adoption

Ripple’s (XRP) gains momentum as the crypto market broadly consolidates, trading at $2.22 at the time of writing on Tuesday. The slight uptick in the XRP price comes amid recovery in the broader crypto market, particularly with Bitcoin (BTC) stepping above $106,000.

AUD/USD: Bulls need to clear 0.6540

AUD/USD: Bulls need to clear 0.6540

AUD/USD reversed part of Monday’s optimism and came all the way down to revisit the 0.6450 region, where its critical 200-day SMA also sits. The marked daily pullback in the pair followed the solid rebound in the US Dollar despite steady concerns on the trade front.

The Best brokers to trade EUR/USD

The Best brokers to trade EUR/USD

SPONSORED Discover the top brokers for trading EUR/USD in 2025. Our list features brokers with competitive spreads, fast execution, and powerful platforms. Whether you're a beginner or an expert, find the right partner to navigate the dynamic Forex market.

Forex MAJORS

Cryptocurrencies

Signatures

Best Brokers of 2025