|

USD/CHF Price Analysis: Struggles at around 0.8900 amid USD weakness, low volatility

  • USD/CHF trades at 0.8908, unable to break the 0.9000 level.
  • 50 and 200-day Moving Averages (DMAs) indicate a lack of trend, staying flat at 0.8774 and 0.9048, respectively.
  • Short-term, technical outlook suggests a neutral to bearish bias, with key support level at around 0.8900.

The Greenback (USD) lost ground versus the Swiss Franc (CHF) after developments during the Asian session weakened the former. China’s positive data, mainly inflation back at positive territory, and hawkish words from the Bank of Japan (BoJ) Governor Kazuo Ueda spurred USD weakness. Hence, the USD/CHF is trading at 0.8908 after hitting a daily high of 0.8926.

USD/CHF Price Analysis: Technical outlook

During the last four trading days, the USD/CHF has remained at around the 0.8900 figure, unable to threaten the 0.9000 figure, as volatility keeps the pair consolidating at around a 40 pip range. It should be said the 50 and 200-day Moving Averages (DMAs) turned flat, with the former below price action at 0.8774, while the latter stays at a bearish position at 0.9048, indicating the lack of a trend. However, price action shows a higher series of peaks and throughs but at the expense of an increase in volatility that could break the trading range.

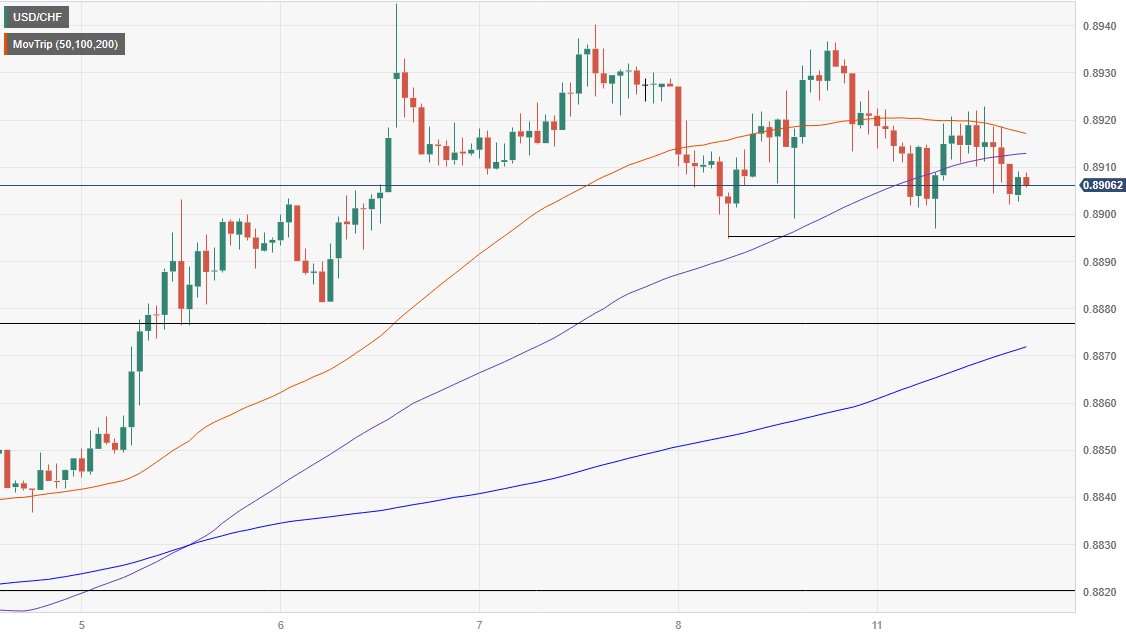
The USD/CHF one-hour chart portrays the pair as neutral to bearish biased, as price action sits below the 50-hour Simple Moving Average (SMA) at 0.8916. However, to reinforce the bias, sellers must crack the September 8 daily low of 0.8895 to challenge the next support area, seen at the September 6 daily low of 0.8881. Once cleared, the next stop would be the 200-hour SMA at 0.8871, followed by the September 5 low of 0.8819. Contrarily, the first resistance is seen at the 50-hour SMA at 0.8916, followed by the September 8 daily high of 0.8936.

USD/CHF Hourly chart

USD/CHF Hourly chart

USD/CHF

Overview
Today last price0.8907
Today Daily Change-0.0023
Today Daily Change %-0.26
Today daily open0.893
 
Trends
Daily SMA200.8832
Daily SMA500.8777
Daily SMA1000.8879
Daily SMA2000.9053
 
Levels
Previous Daily High0.8937
Previous Daily Low0.8895
Previous Weekly High0.8945
Previous Weekly Low0.8833
Previous Monthly High0.8876
Previous Monthly Low0.869
Daily Fibonacci 38.2%0.8921
Daily Fibonacci 61.8%0.8911
Daily Pivot Point S10.8904
Daily Pivot Point S20.8879
Daily Pivot Point S30.8862
Daily Pivot Point R10.8946
Daily Pivot Point R20.8962
Daily Pivot Point R30.8988
 

Author

Christian Borjon Valencia

Markets analyst, news editor, and trading instructor with over 14 years of experience across FX, commodities, US equity indices, and global macro markets.

More from Christian Borjon Valencia
Share:

Editor's Picks

EUR/USD accelerates losses, focus is on 1.1800

EUR/USD’s selling pressure is gathering pace now, opening the door to a potential test of the key 1.1800 region sooner rather than later. The pair’s pullback comes on the back of marked gains in the US Dollar following US data releases and the publication of the FOMC Minutes later in the day.

GBP/USD turns negative near 1.3540

GBP/USD reverses its initial upside momentum and is now adding to previous declines, revisiting at the same time the 1.3540 region on Wednesday. Cable’s downtick comes on the back of decent gains in the Greenback and easing UK inflation figures, which seem to have reinforced the case for a BoE rate cut in March.

Gold picks pace, flirts with $5,000

Gold is back on the front foot on Wednesday, shaking off part of the early week softness and pushing higher towards the key $5,000 mark per troy ounce. The move comes ahead of the FOMC Minutes and is unfolding despite an intense rebound in the US Dollar.

Fed Minutes to shed light on January hold decision amid hawkish rate outlook

The Minutes of the Fed’s January 27-28 monetary policy meeting will be published today. Details of discussions on the decision to leave the policy rate unchanged will be scrutinized by investors.

Mixed UK inflation data no gamechanger for the Bank of England

Food inflation plunged in January, but service sector price pressure is proving stickier. We continue to expect Bank of England rate cuts in March and June. The latest UK inflation read is a mixed bag for the Bank of England, but we doubt it drastically changes the odds of a March rate cut.

Sui extends sideways action ahead of Grayscale’s GSUI ETF launch

Sui is extending its downtrend for the second consecutive day, trading at 0.95 at the time of writing on Wednesday. The Layer-1 token is down over 16% in February and approximately 34% from the start of the year, aligning with the overall bearish sentiment across the crypto market.