|

USD/CHF Price Analysis: Struggles at 0.8800 amid mixed technical signals

  • USD/CHF climbs by 0.20%, trading at 0.8780, but remains under the shadow of the 0.8800 resistance.
  • The pair displays a ‘double-top’ chart pattern, suggesting potential downside movement.
  • Key resistances to watch: 50-day EMA at 0.8811 and 100-day EMA at 0.8921.
  • Immediate supports lie at the 20-day EMA at 0.8746 and the August 10 low of 0.8689.

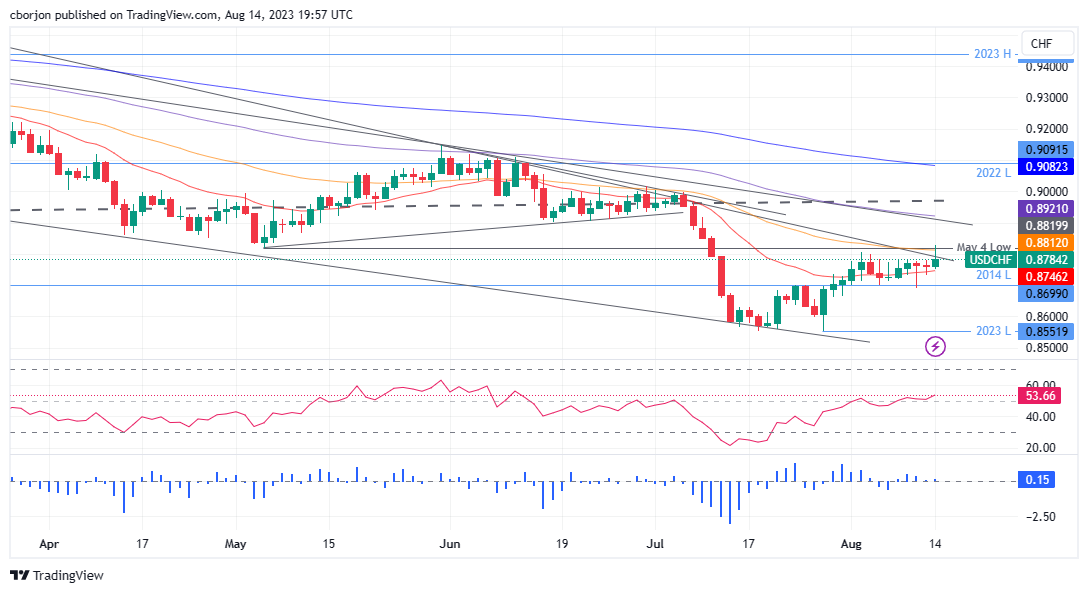
The USD/CHF climbed modestly on Monday’s session though it failed to cling above the 0.8800 figure, which could weigh on the pair in the near term. Additionally, the USD/CHF failing to break a downslope resistance trendline drawn from November 2022 highs opened the door for further losses. The USD/CHF is trading at 0.8780, gains 0.20% but remains subject to selling pressure.

USD/CHF Price Analysis: Technical outlook

From a technical standpoint, the USD/CHF registered a ‘double-top’ chart pattern, which could pave the way for further downside, but mixed signals from an oscillator perspective could refrain sellers from lowering prices.

The Relative Strength Index (RSI) indicates that buyers are gathering momentum, while the three-day Rate of Change (RoC) depicts the USD/CHF as neutral.

If USD/CHF buyers reclaim 0.8800, they must reclaim the 50-day Exponential Moving Average (EMA) at 0.8811. A breach of the latter would expose the 100-day EMA at 0.8921.

Conversely, if USD/CHF sellers remain in control, the next support would be the 20-day EMA at 0.8746. Break below will expose the August 10 low of 0.8689, followed by the year-to-date (YTD) low of 0.8551.

USD/CHF Price Action – Daily chart

USD/CHF

Overview
Today last price0.878
Today Daily Change0.0015
Today Daily Change %0.17
Today daily open0.8765
 
Trends
Daily SMA200.8697
Daily SMA500.8842
Daily SMA1000.8921
Daily SMA2000.9124
 
Levels
Previous Daily High0.8781
Previous Daily Low0.8735
Previous Weekly High0.8783
Previous Weekly Low0.869
Previous Monthly High0.9005
Previous Monthly Low0.8552
Daily Fibonacci 38.2%0.8753
Daily Fibonacci 61.8%0.8763
Daily Pivot Point S10.874
Daily Pivot Point S20.8715
Daily Pivot Point S30.8695
Daily Pivot Point R10.8786
Daily Pivot Point R20.8806
Daily Pivot Point R30.8831
 

Author

Christian Borjon Valencia

Markets analyst, news editor, and trading instructor with over 14 years of experience across FX, commodities, US equity indices, and global macro markets.

More from Christian Borjon Valencia
Share:

Editor's Picks

EUR/USD flirts with daily highs, retargets 1.1900

EUR/USD regains upside traction, returning to the 1.1880 zone and refocusing its attention to the key 1.1900 barrier. The pair’s slight gains comes against the backdrop of a humble decline in the US Dollar as investors continue to assess the latest US CPI readings and the potential Fed’s rate path.

GBP/USD remains well bid around 1.3650

GBP/USD maintains its upside momentum in place, hovering around daily highs near 1.3650 and setting aside part of the recent three-day drop. Cable’s improved sentiment comes on the back of the Greenback’s  irresolute price action, while recent hawkish comments from the BoE’s Pill also collaborate with the uptick.

Gold clings to gains just above $5,000/oz

Gold is reclaiming part of the ground lost on Wednesday’s marked decline, as bargain-hunters keep piling up and lifting prices past the key $5,000 per troy ounce. The precious metal’s move higher is also underpinned by the slight pullback in the US Dollar and declining US Treasury yields across the curve.

Crypto Today: Bitcoin, Ethereum, XRP in choppy price action, weighed down by falling institutional interest 

Bitcoin's upside remains largely constrained amid weak technicals and declining institutional interest. Ethereum trades sideways above $1,900 support with the upside capped below $2,000 amid ETF outflows.

Week ahead – Data blitz, Fed Minutes and RBNZ decision in the spotlight

US GDP and PCE inflation are main highlights, plus the Fed minutes. UK and Japan have busy calendars too with focus on CPI. Flash PMIs for February will also be doing the rounds. RBNZ meets, is unlikely to follow RBA’s hawkish path.

Ripple Price Forecast: XRP potential bottom could be in sight

Ripple edges up above the intraday low of $1.35 at the time of writing on Friday amid mixed price actions across the crypto market. The remittance token failed to hold support at $1.40 the previous day, reflecting risk-off sentiment amid a decline in retail and institutional sentiment.