- The Swiss franc gained more than 2.50% vs. the greenback.
- A dampened market mood and a strong US dollar capped the USD/CHF nosedive in the week.
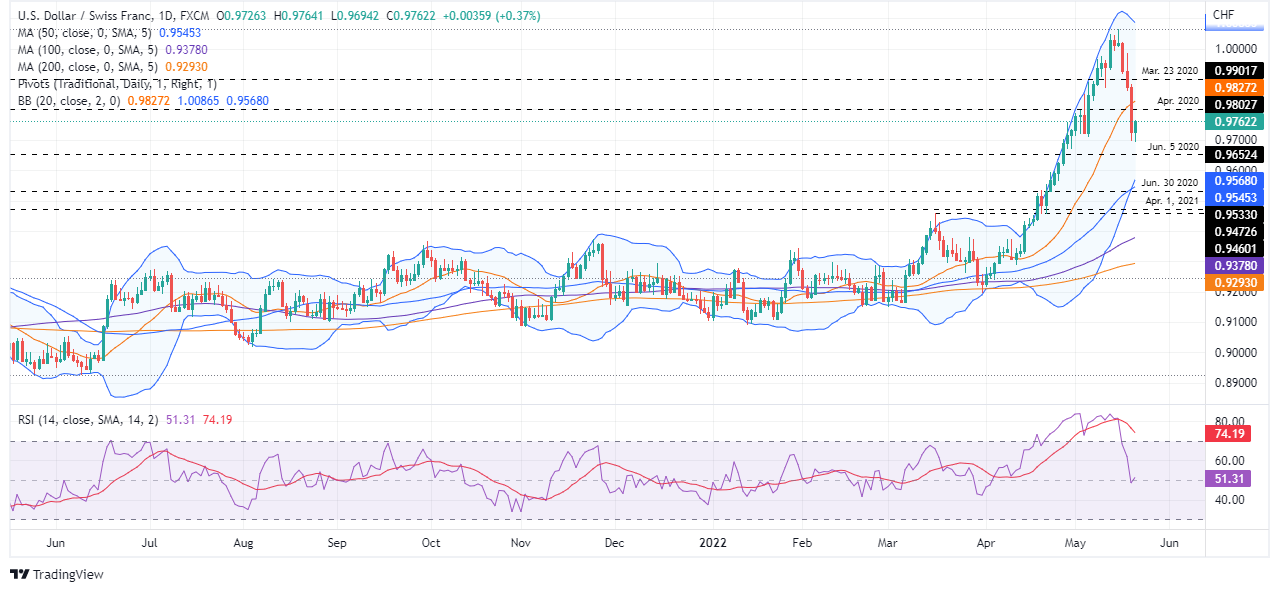
- USD/CHF Price Forecast: Although the major held a massive loss in the week, it remains upward biased unless USD/CHF bears push the pair below the 0.9700 mark.
The USD/CHF is trimming some of its losses, bouncing off the weekly lows at around 0.9700 and pushing to reclaim 0.9750, amidst a dismal sentiment portrayed by US equities recording losses. Also, broad US dollar strength is a tailwind for the pair, despite hefty losses in the 10-year US Treasury yield, which fell from 3% to 2.785%, near weekly lows. At 0.9762, the USD/CHF is gaining 0.35% and eyes to pierce the 20-DMA at around 0.9827.
From a technical perspective, the USD/CHF tumbled in total 250-pips after reaching parity on May 12. USD/CHF traders would need to be aware that Friday’s uptick spurred a reaction in the Relative Strength Index (RSI), which plunged from overbought levels to the 50-midline, and as of writing, it is aiming up at 51.28.
USD/CHF Price Forecast: Technical outlook
That said, the USD/CHF remains upward biased, as the daily moving averages (DMAs) are still below the spot price. The USD/CHF first resistance would be the figure at 0.9800. A breach of the latter would expose the 20-DMA at 0.9827, followed by March 23, 2020, a daily high at 0.9901, and then the parity.
On the flip side, the USD/CHF first support would be 0.9700. Break below would expose the 0.9600 mark, closely followed by the 50-DMA at 0.9545.
Key Technical Levels
Information on these pages contains forward-looking statements that involve risks and uncertainties. Markets and instruments profiled on this page are for informational purposes only and should not in any way come across as a recommendation to buy or sell in these assets. You should do your own thorough research before making any investment decisions. FXStreet does not in any way guarantee that this information is free from mistakes, errors, or material misstatements. It also does not guarantee that this information is of a timely nature. Investing in Open Markets involves a great deal of risk, including the loss of all or a portion of your investment, as well as emotional distress. All risks, losses and costs associated with investing, including total loss of principal, are your responsibility. The views and opinions expressed in this article are those of the authors and do not necessarily reflect the official policy or position of FXStreet nor its advertisers. The author will not be held responsible for information that is found at the end of links posted on this page.
If not otherwise explicitly mentioned in the body of the article, at the time of writing, the author has no position in any stock mentioned in this article and no business relationship with any company mentioned. The author has not received compensation for writing this article, other than from FXStreet.
FXStreet and the author do not provide personalized recommendations. The author makes no representations as to the accuracy, completeness, or suitability of this information. FXStreet and the author will not be liable for any errors, omissions or any losses, injuries or damages arising from this information and its display or use. Errors and omissions excepted.
The author and FXStreet are not registered investment advisors and nothing in this article is intended to be investment advice.
Recommended content
Editors’ Picks
EUR/USD stays in positive territory above 1.0850 after US data

EUR/USD clings to modest daily gains above 1.0850 in the second half of the day on Friday. The improving risk mood makes it difficult for the US Dollar to hold its ground after PCE inflation data, helping the pair edge higher ahead of the weekend.
GBP/USD stabilizes above 1.2850 as risk mood improves

GBP/USD maintains recovery momentum and fluctuates above 1.2850 in the American session on Friday. The positive shift seen in risk mood doesn't allow the US Dollar to preserve its strength and supports the pair.
Gold rebounds above $2,380 as US yields stretch lower

Following a quiet European session, Gold gathers bullish momentum and trades decisively higher on the day above $2,380. The benchmark 10-year US Treasury bond yield loses more than 1% on the day after US PCE inflation data, fuelling XAU/USD's upside.
Avalanche price sets for a rally following retest of key support level

Avalanche (AVAX) price bounced off the $26.34 support level to trade at $27.95 as of Friday. Growing on-chain development activity indicates a potential bullish move in the coming days.
The election, Trump's Dollar policy, and the future of the Yen

After an assassination attempt on former President Donald Trump and drop out of President Biden, Kamala Harris has been endorsed as the Democratic candidate to compete against Trump in the upcoming November US presidential election.