|

USD/CHF Price Analysis: Steadily advances above 0.9350 after breaking a falling wedge

  • USD/CHF climbs steadily, bolstered by US economic data and speculation for further Fed tightening.
  • The USD/CHF pairs bounced at around a top-trendline of a falling wedge which turned support around 0.9250.
  • A daily close above 0.9366 could send the USD/CHF rallying towards 0.9400 and beyond.

The USD/CHF erases Wednesday’s losses and rises more than 70 pips on Thursday, clearing on its way north solid resistance levels, like the 20-day Exponential Moving Average (EMA) at 0.9322. Factors like the release of robust labor market data in the United States (US) lifted the USD/CHF from around daily lows of 0.9260. At the time of writing, the USD/CHF is trading at 0.9360.

USD/CHF Price Analysis: Technical outlook

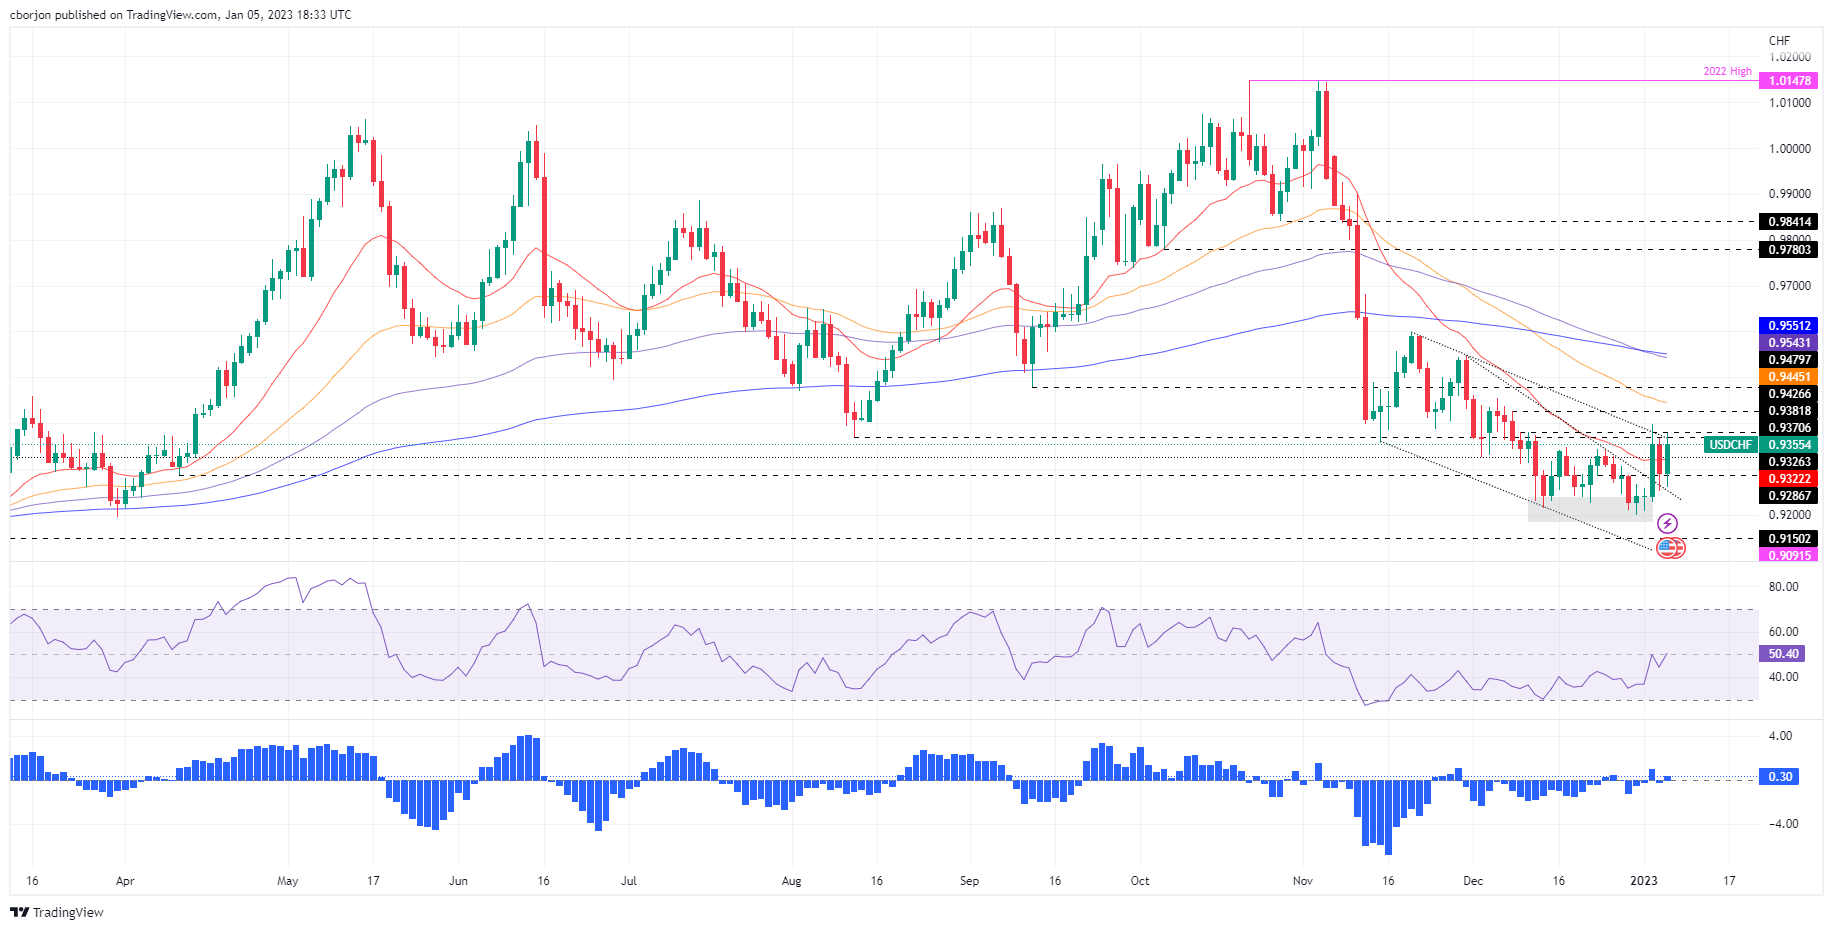
After finding support at around 0.9200, the USD/CHF resumed its uptrend, eyeing a break above Wednesday’s daily high of 0.9366. The USD/CHF dropped towards the top-trend line of a falling wedge, previously broken during the week, turned support. Hence, the major bounced at around 0.9250 and aimed toward a downslope resistance trendline that passed around 0.9370.

If the USD/CHF achieves a daily close above 0.9366, that could open the door for further upside, implying a test of the 0.9400 mark, which, once cleared, would send the USD/CHF aiming towards the 100-day EMA at 0.9445, followed by a test of 0.9500.

As an alternate scenario, the USD/CHF first support would be the 20-day EMA at 0.9322, followed by the 0.9300 figure and the top trendline of a falling wedge that resides around 0.9250.

USD/CHF Key Technical Levels

USD/CHF

Overview
Today last price0.9355
Today Daily Change0.0055
Today Daily Change %0.59
Today daily open0.93
 
Trends
Daily SMA200.9301
Daily SMA500.9499
Daily SMA1000.9649
Daily SMA2000.9644
 
Levels
Previous Daily High0.9375
Previous Daily Low0.9253
Previous Weekly High0.9338
Previous Weekly Low0.9201
Previous Monthly High0.9471
Previous Monthly Low0.9201
Daily Fibonacci 38.2%0.93
Daily Fibonacci 61.8%0.9328
Daily Pivot Point S10.9244
Daily Pivot Point S20.9188
Daily Pivot Point S30.9122
Daily Pivot Point R10.9365
Daily Pivot Point R20.9431
Daily Pivot Point R30.9487

Author

Christian Borjon Valencia

Markets analyst, news editor, and trading instructor with over 14 years of experience across FX, commodities, US equity indices, and global macro markets.

More from Christian Borjon Valencia
Share:

Editor's Picks

EUR/USD slumps below 1.1800 on hawkish Fed Minutes, eyes on ECB succession

The EUR/USD pair tumbles to a near two-week low around 1.1785 during the early Asian session on Thursday. The US Dollar strengthens against the Euro on hawkish FOMC minutes that revived speculation about potential interest rate hikes if inflation remains elevated. 

GBP/USD extends decline as weak jobs data bolsters BoE rate cut bets

The Pound Sterling continued to backslide under sustained pressure on Wednesday, following through after the UK employment report on Tuesday showed a labour market deteriorating faster than expected. 

Gold consolidates the rebound below $5,000, US data eyed

Gold price consolidates the previous rebound below $5,000 in the Asian session on Thursday. The precious metal recovered on Wednesday amid shifts in geopolitical sentiment, boosting safe-haven demand. Traders will keep an eye on the release of US Initial Jobless Claims,  Pending Home Sales data, and the Fedspeak later on Thursday. 

Bitcoin approaches a critical zone: Bear pennant projects $56,000

Based on the most recent analyses from February 2026, the short answer is that it is highly unlikely that Bitcoin will reach $100,000 this month.

Mixed UK inflation data no gamechanger for the Bank of England

Food inflation plunged in January, but service sector price pressure is proving stickier. We continue to expect Bank of England rate cuts in March and June. The latest UK inflation read is a mixed bag for the Bank of England, but we doubt it drastically changes the odds of a March rate cut.

Sui extends sideways action ahead of Grayscale’s GSUI ETF launch

Sui is extending its downtrend for the second consecutive day, trading at 0.95 at the time of writing on Wednesday. The Layer-1 token is down over 16% in February and approximately 34% from the start of the year, aligning with the overall bearish sentiment across the crypto market.