|

USD/CHF Price Analysis: Seesaws around the 20-day EMA, stays above 0.8700

  • USD/CHF printed a ‘bearish-harami’ candlestick pattern but failed to extend its losses past the last week’s low.
  • Monday’s ‘gravestone-doji’ indicates traders’ uncertainty regarding a further downward move.
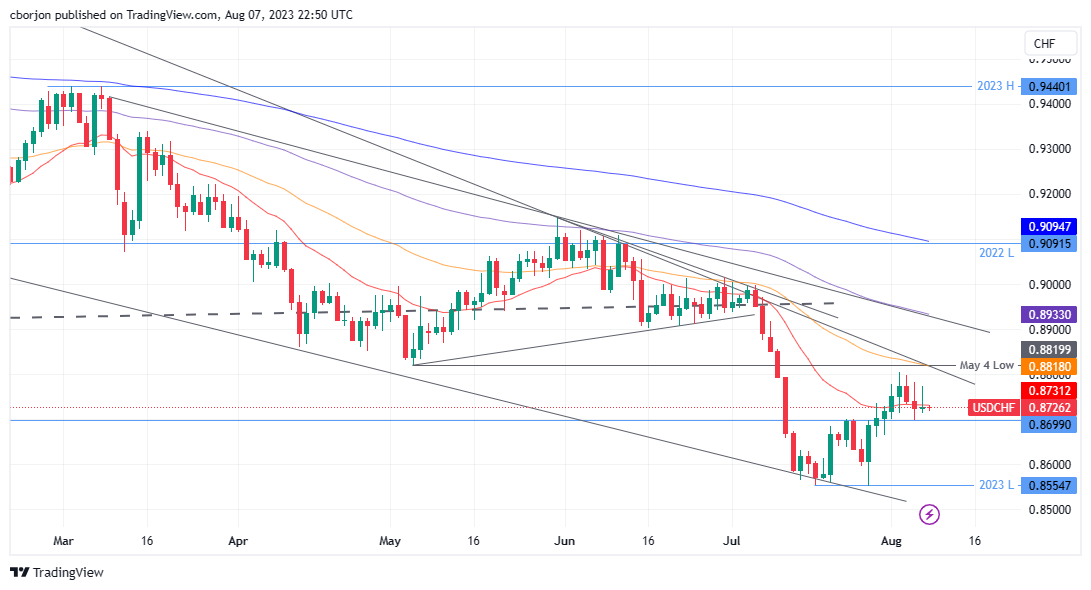
  • USD/CHF key support emerges at 0.8699, while the first resistance lies at 0.8731.

USD/CHF held to minimal gains of 0.03% on Monday, seesaws above/below the 20-day Exponential Moving Average (EMA) of 0.8731 as the Asian session begins. Nevertheless, the USD/CHF remains in a downtrend, and exchanges hands at 0.8726, down 0.01%.

USD/CHF Price Analysis: Technical outlook

After forming a ‘bearish-harami’ candlestick chart pattern, the USD/CHF resumed its downtrend last Thursday, but Monday’s price action forming a ‘gravestone-doji’ portrays traders’ indecision about extending its losses toward last week’s low of 0.8699.

If USD/CHF drops below the latter, the pair might extend its losses toward the year-to-date (YTD) low of 0.8554, threatening to extend its plunge toward the 0.8500 figure. Conversely, if USD/CHF buyers reclaim the 20-day EMA, that could pave the way for further upside.

First resistance would emerge at the 0.8800 figure. Once buyers conquer that level, up next would be the May 4 low-turned resistance at 0.8819, followed by the 0.8900 mark.

USD/CHF Price Action – Daily chart

USD/CHF Daily chart

USD/CHF

Overview
Today last price0.8726
Today Daily Change-0.0001
Today Daily Change %-0.01
Today daily open0.8727
 
Trends
Daily SMA200.8684
Daily SMA500.8873
Daily SMA1000.8944
Daily SMA2000.9155
 
Levels
Previous Daily High0.8783
Previous Daily Low0.87
Previous Weekly High0.8806
Previous Weekly Low0.8665
Previous Monthly High0.9005
Previous Monthly Low0.8552
Daily Fibonacci 38.2%0.8731
Daily Fibonacci 61.8%0.8751
Daily Pivot Point S10.869
Daily Pivot Point S20.8653
Daily Pivot Point S30.8607
Daily Pivot Point R10.8773
Daily Pivot Point R20.8819
Daily Pivot Point R30.8856

Author

Christian Borjon Valencia

Christian Borjon began his career as a retail trader in 2010, mainly focused on technical analysis and strategies around it. He started as a swing trader, as he used to work in another industry unrelated to the financial markets.

More from Christian Borjon Valencia
Share:

Markets move fast. We move first.

Orange Juice Newsletter brings you expert driven insights - not headlines. Every day on your inbox.

By subscribing you agree to our Terms and conditions.

Editor's Picks

EUR/USD trades with negative bias around 1.1730 amid recovering USD; downside seems limited

The EUR/USD pair kicks off the new week on a softer note, though it remains within striking distance of the highest level since early October, touched last Thursday. Spot prices currently trade around the 1.1730 region, down less than 0.10% for the day.

GBP/USD holds steady above mid-1.3300s as traders await key data and BoE this week

The GBP/USD pair remains on the defensive during the Asian session on Monday, though it lacks bearish conviction and holds above the 200-day Simple Moving Average pivotal support. Spot prices currently trade around the 1.3360 region, nearly unchanged for the day.

Gold retains bullish bias ahead of this week’s key US macro releases

Gold attracts buyers for the fifth straight day and climbs to the $4,330 region during the Asian session on Monday. The commodity remains well within striking distance of its highest level since October 21, touched on Friday, and seems poised to appreciate further amid a supportive fundamental backdrop. 

Top Crypto Losers: DASH, SPX, PENGU – Privacy and meme coins lose ground

Altcoins, including Dash, SPX6900, and Pudgy Penguins, are leading losses as the broader cryptocurrency market remains cautious ahead of the macroeconomic data releases, such as the US Nonfarm payroll report, CPI data, and the Bank of Japan’s rate-hike decision.

Big week ends with big doubts

The S&P 500 continued to push higher yesterday as the US 2-year yield wavered around the 3.50% mark following a Federal Reserve (Fed) rate cut earlier this week that was ultimately perceived as not that hawkish after all. The cut is especially boosting the non-tech pockets of the market.

Aave Price Forecast: AAVE primed for breakout as bullish signals strengthen

Aave (AAVE) price is trading above $204 at the time of writing on Friday and approaching the upper boundary of its descending parallel channel; a breakout from this structure would favor the bulls.