|

USD/CHF Price Analysis: Retreats to a two-day low, after facing the 0.8700 barrier

  • The USD/CHF downtrend remains intact, with a path of least resistance downwards as long as it remains below the 61.8% Fibonacci retracement level at 0.8819.
  • Sellers might extend their drive and test the year-to-date (YTD) low of 0.8554 if the pair crosses the 0.8600 mark.
  • From an oscillator perspective, the downward aiming Relative Strength Index (RSI) and sellers' influence suggested by the three-day Rate of Change (RoC) align with the bearish bias.

USD/CHF retreats after reaching a daily high of 0.8700 and drops to a new two-day low amid a risk-on mood ahead of the US Federal Reserve (Fed) monetary policy decision. At the time of writing, the USD/CHF exchanges hands at 0.8640, down 0.59%.

USD/CHF Price Analysis: Technical outlook

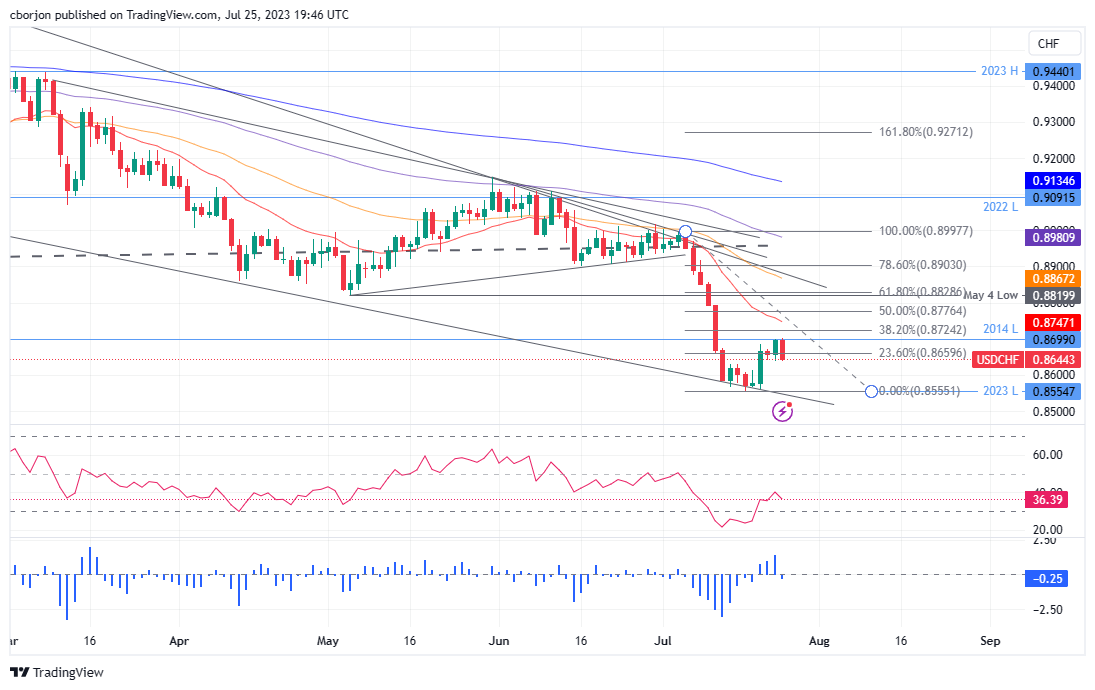
The USD/CHF downtrend remains intact as long as the exchange rate stays below the May 4 daily low of 0.8819, confluence with the 61.8% Fibonacci (Fibo) retracement. Once that level is broken, the next resistance will emerge at the next confluence of the 50-day EMA and the 78.6% Fibo level at the 0.8875/0.8900 area, followed by the 0.9000 mark.

Nonetheless, the USD/CHF path of least resistance is downwards, as it resumed its fall to a fresh two-day low, past the 23.6% Fibo retracement at 0.8659. The following support emerges at the 0.8600 figure, and if sellers gather momentum, it could extend and test the year-to-date (YTD) low of 0.8554.

From an oscillator standpoint, the Relative Strength Index (RSI) aimed downward as the USD/CHF downtrend resumed, while the three-day Rate of Change (RoC) portrays sellers' entering the market.

USD/CHF Price Action – Daily chart

USD/CHF Daily chart

USD/CHF

Overview
Today last price0.8644
Today Daily Change-0.0053
Today Daily Change %-0.61
Today daily open0.8697
 
Trends
Daily SMA200.8797
Daily SMA500.8929
Daily SMA1000.8996
Daily SMA2000.9212
 
Levels
Previous Daily High0.87
Previous Daily Low0.8638
Previous Weekly High0.8684
Previous Weekly Low0.8555
Previous Monthly High0.912
Previous Monthly Low0.8902
Daily Fibonacci 38.2%0.8676
Daily Fibonacci 61.8%0.8661
Daily Pivot Point S10.8656
Daily Pivot Point S20.8616
Daily Pivot Point S30.8594
Daily Pivot Point R10.8719
Daily Pivot Point R20.8741
Daily Pivot Point R30.8781

Author

Christian Borjon Valencia

Christian Borjon began his career as a retail trader in 2010, mainly focused on technical analysis and strategies around it. He started as a swing trader, as he used to work in another industry unrelated to the financial markets.

More from Christian Borjon Valencia
Share:

Markets move fast. We move first.

Orange Juice Newsletter brings you expert driven insights - not headlines. Every day on your inbox.

By subscribing you agree to our Terms and conditions.

Editor's Picks

EUR/USD clings to small gains near 1.1750

Following a short-lasting correction in the early European session, EUR/USD regains its traction and clings to moderate gains at around 1.1750 on Monday. Nevertheless, the pair's volatility remains low, with investors awaiting this weeks key US data releases and the ECB policy announcements.

GBP/USD edges higher toward 1.3400 as traders await key data and BoE

GBP/USD reverses its direction and advances toward 1.3400 following a drop to the 1.3350 area earlier in the day. The US Dollar struggles to gather recovery momentum as markets await Tuesday's Nonfarm Payrolls data, while the Pound Sterling holds steady ahead of the BoE policy announcements later in the week.

Gold builds on previous week's gains, approaches $4,350

Gold preserves its bullish momentum after rising more than 2% last week and climbs toward $4,350 on Monday. The precious metal extends its upside as the US Dollar remains on the back foot on growing expectations for a dovish Fed policy outlook next year.

Solana consolidates as spot ETF inflows near $1 billion signal institutional dip-buying

Solana price hovers above $131 at the time of writing on Monday, nearing the upper boundary of a falling wedge pattern, awaiting a decisive breakout. On the institutional side, demand for spot Solana Exchange-Traded Funds remained firm, pushing total assets under management to nearly $1 billion since launch. 

Big week ends with big doubts

The S&P 500 continued to push higher yesterday as the US 2-year yield wavered around the 3.50% mark following a Federal Reserve (Fed) rate cut earlier this week that was ultimately perceived as not that hawkish after all. The cut is especially boosting the non-tech pockets of the market.

Solana Price Forecast: SOL consolidates as spot ETF inflows near $1 billion signal institutional dip-buying

Solana (SOL) price hovers above $131 at the time of writing on Monday, nearing the upper boundary of a falling wedge pattern, awaiting a decisive breakout.