|

USD/CHF Price Analysis: Pullbacks from weekly highs, as a triple-top emerges in the H4

  • USD/CHF retraces from weekly highs and dives below the 0.9800 figure due to a risk-on impulse.
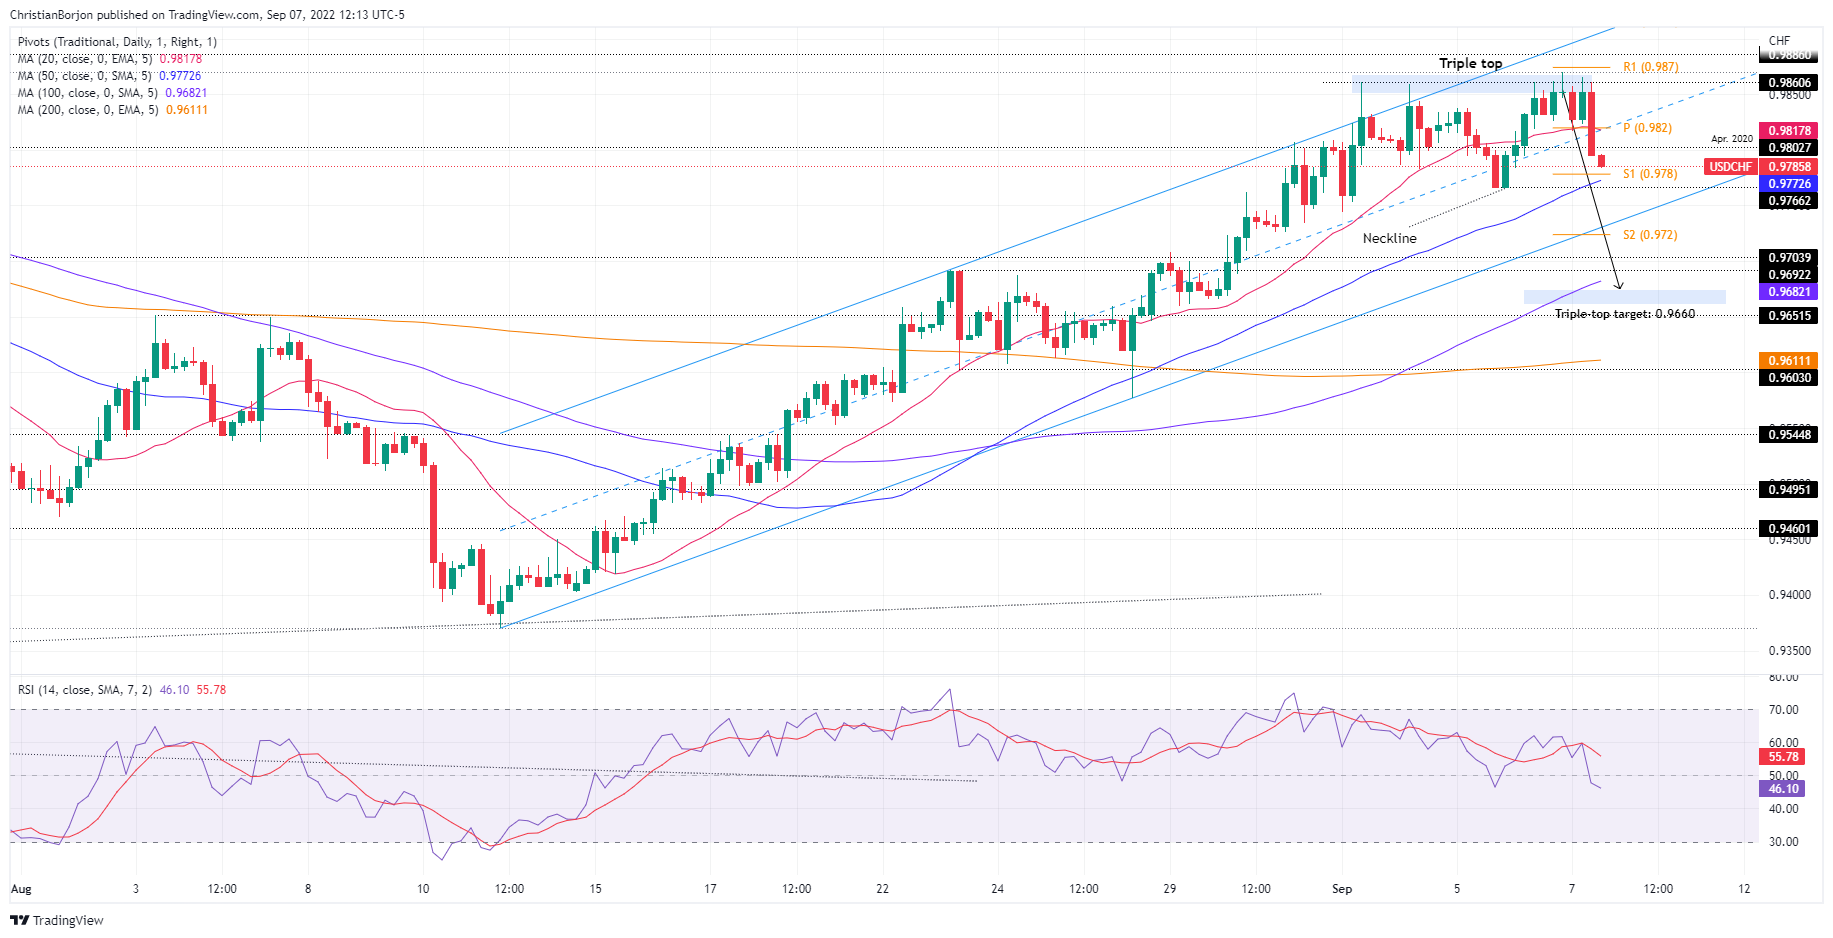
  • A triple-top chart pattern in the 4-hour chart keeps the USD/CHF under some selling pressure, targeting a fall to 0.9660.

USD/CHF slides from weekly highs reached at around 0.9869 on Wednesday, despite risk appetite improving, which usually benefits riskier assets during the day. The USD/CHF is trading at 0.9783, below its opening price, by 0.51%.

USD/CHF Price Analysis: Technical outlook

The USD/CHF is pulling back after reaching a solid weekly high at around 0.9869, set during the overlap of the Asian/European session, courtesy of market sentiment shifting sour. Nevertheless, as the North American session progressed, investors’ mood improved, as seen by US equities trading in the green.

In the USD/CHF case, the Swiss Franc strength dragged prices lower, so far clearing on its way south the 0.9800 figure.

Short term, the USD/CHF four-hour chart, illustrates a formation of a triple-top chart pattern, and so far, the major is retreating from weekly high levels, approaching the “neckline” around the 0.9766 area. A decisive breach of the latter could send the major tumbling towards the triple-top measured target at 0.9660, but first, it will need to overcome some hurdles on its way south.

The USD/CHF first support would be the bottom-trend line of an ascending channel drawn since August 11, around 0.9720, followed by the 0.9700 figure, followed by the 100-EMA at 0.9680.

USD/CHF Key Technical Levels

USD/CHF

Overview
Today last price0.9783
Today Daily Change-0.0045
Today Daily Change %-0.46
Today daily open0.984
 
Trends
Daily SMA200.963
Daily SMA500.9644
Daily SMA1000.9689
Daily SMA2000.9468
 
Levels
Previous Daily High0.9862
Previous Daily Low0.9766
Previous Weekly High0.9861
Previous Weekly Low0.9658
Previous Monthly High0.9808
Previous Monthly Low0.9371
Daily Fibonacci 38.2%0.9825
Daily Fibonacci 61.8%0.9803
Daily Pivot Point S10.9784
Daily Pivot Point S20.9727
Daily Pivot Point S30.9687
Daily Pivot Point R10.988
Daily Pivot Point R20.9919
Daily Pivot Point R30.9976

Author

Christian Borjon Valencia

Christian Borjon began his career as a retail trader in 2010, mainly focused on technical analysis and strategies around it. He started as a swing trader, as he used to work in another industry unrelated to the financial markets.

More from Christian Borjon Valencia
Share:

Markets move fast. We move first.

Orange Juice Newsletter brings you expert driven insights - not headlines. Every day on your inbox.

By subscribing you agree to our Terms and conditions.

Editor's Picks

EUR/USD clings to small gains near 1.1750

Following a short-lasting correction in the early European session, EUR/USD regains its traction and clings to moderate gains at around 1.1750 on Monday. Nevertheless, the pair's volatility remains low, with investors awaiting this weeks key US data releases and the ECB policy announcements.

GBP/USD edges higher toward 1.3400 as traders await key data and BoE

GBP/USD reverses its direction and advances toward 1.3400 following a drop to the 1.3350 area earlier in the day. The US Dollar struggles to gather recovery momentum as markets await Tuesday's Nonfarm Payrolls data, while the Pound Sterling holds steady ahead of the BoE policy announcements later in the week.

Gold builds on previous week's gains, approaches $4,350

Gold preserves its bullish momentum after rising more than 2% last week and climbs toward $4,350 on Monday. The precious metal extends its upside as the US Dollar remains on the back foot on growing expectations for a dovish Fed policy outlook next year.

Solana consolidates as spot ETF inflows near $1 billion signal institutional dip-buying

Solana price hovers above $131 at the time of writing on Monday, nearing the upper boundary of a falling wedge pattern, awaiting a decisive breakout. On the institutional side, demand for spot Solana Exchange-Traded Funds remained firm, pushing total assets under management to nearly $1 billion since launch. 

Big week ends with big doubts

The S&P 500 continued to push higher yesterday as the US 2-year yield wavered around the 3.50% mark following a Federal Reserve (Fed) rate cut earlier this week that was ultimately perceived as not that hawkish after all. The cut is especially boosting the non-tech pockets of the market.

Solana Price Forecast: SOL consolidates as spot ETF inflows near $1 billion signal institutional dip-buying

Solana (SOL) price hovers above $131 at the time of writing on Monday, nearing the upper boundary of a falling wedge pattern, awaiting a decisive breakout.