USD/CHF Price Analysis: Posts slight gains despite bullish hurdles; faces resistance at 0.8980


  • USD/CHF records minor gains and struggles to rally past 0.8980 due to weak buying momentum.
  • Technical indicators point towards a neutral to downward bias, with immediate support at a May 22 low of 0.8940.
  • RSI and three-day Rate of Change indicate downward bias; a fall below 0.8940 could lead to further losses.

USD/CHF registers minuscule gains as the Asian session begins after printing back-to-back bullish days, though it failed to cement a rally past the 0.8980 area. On Monday, the USD/CHF printed a weekly high at 0.8975 but closed the session at around 0.8950. At the time of writing, the USD/CHF exchanges hands at 0.8957.

USD/CHF Price Analysis: Technical outlook

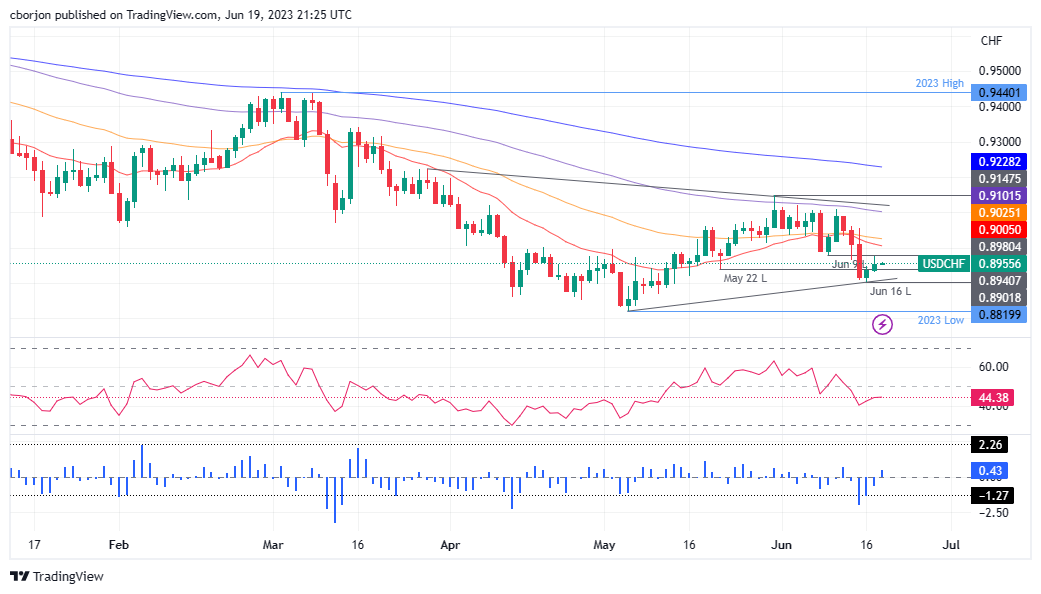
From a technical perspective, the USD/CHF is neutral to downward biased,  as it stands below the daily Exponential Moving Averages (EMAs). The downtrend shows signs of losing steam, though price action in the last couple of days left two candlesticks with larger wicks above the natural body. This signifies that buyers did not have the strength to hold prices higher, opening the door for further losses.

The USD/CHF first support would be the May 22 low at 0.8940. Break below, and the USD/CHF would dive toward the June 16 daily low at 0.8902 before cracking 0.8900. A breach of the latter will expose the YTD low of 0.8819. Conversely, USD/CHF's immediate resistance lies at 0.8980, June 9 low, before testing 0.9000.

Oscillators-wise, the Relative Strength Index (RSI) indicator portrays the pair as downward biased, though the three-day Rate of Change depicts buyers who stepped in but failed to break the previous peak.

USD/CHF Price Action – Daily chart

USD/CHF Daily chart

USD/CHF

Overview
Today last price 0.8961
Today Daily Change 0.0021
Today Daily Change % 0.23
Today daily open 0.894
 
Trends
Daily SMA20 0.9039
Daily SMA50 0.8983
Daily SMA100 0.9109
Daily SMA200 0.9339
 
Levels
Previous Daily High 0.895
Previous Daily Low 0.8902
Previous Weekly High 0.9109
Previous Weekly Low 0.8902
Previous Monthly High 0.9148
Previous Monthly Low 0.882
Daily Fibonacci 38.2% 0.8931
Daily Fibonacci 61.8% 0.892
Daily Pivot Point S1 0.8911
Daily Pivot Point S2 0.8882
Daily Pivot Point S3 0.8863
Daily Pivot Point R1 0.8959
Daily Pivot Point R2 0.8978
Daily Pivot Point R3 0.9007


Share: Feed news

Information on these pages contains forward-looking statements that involve risks and uncertainties. Markets and instruments profiled on this page are for informational purposes only and should not in any way come across as a recommendation to buy or sell in these assets. You should do your own thorough research before making any investment decisions. FXStreet does not in any way guarantee that this information is free from mistakes, errors, or material misstatements. It also does not guarantee that this information is of a timely nature. Investing in Open Markets involves a great deal of risk, including the loss of all or a portion of your investment, as well as emotional distress. All risks, losses and costs associated with investing, including total loss of principal, are your responsibility. The views and opinions expressed in this article are those of the authors and do not necessarily reflect the official policy or position of FXStreet nor its advertisers. The author will not be held responsible for information that is found at the end of links posted on this page.

If not otherwise explicitly mentioned in the body of the article, at the time of writing, the author has no position in any stock mentioned in this article and no business relationship with any company mentioned. The author has not received compensation for writing this article, other than from FXStreet.

FXStreet and the author do not provide personalized recommendations. The author makes no representations as to the accuracy, completeness, or suitability of this information. FXStreet and the author will not be liable for any errors, omissions or any losses, injuries or damages arising from this information and its display or use. Errors and omissions excepted.

The author and FXStreet are not registered investment advisors and nothing in this article is intended to be investment advice.

Recommended content


Recommended content

Editors’ Picks

AUD/USD faces the next hurdle at 0.6400

AUD/USD faces the next hurdle at 0.6400

AUD/USD rose markedly and approached the key 0.6400 hurdle at the beginning of the week, always in response to rising weakness in the US Dollar and hopes of fresh stimulus in China.

AUD/USD News
EUR/USD keeps the upside target at 1.1000

EUR/USD keeps the upside target at 1.1000

EUR/USD extended further Friday’s recovery and traded at shouting distance from the YTD peaks near 1.0950 in response to increased selling pressure in the Greenback and the improved political scenario in Germany.

EUR/USD News
Gold consolidates around $3,000 ahead of Fed

Gold consolidates around $3,000 ahead of Fed

Gold prices has started the week on a positive tone and maintains their trade around the key $3,000 mark per troy ounce on the back of the modest pullback in the Greenback and mixed US yields across the curve,

Gold News
Crypto markets could gain $1 trillion as Gold price reaches $3,000: Tokenized-Gold expert explains

Crypto markets could gain $1 trillion as Gold price reaches $3,000: Tokenized-Gold expert explains

Tokenized-Gold assets hit a $1.8 billion market cap on Monday after the Gold (XAU) price marked new all-time highs above $3,000 per troy ounce. In an exclusive interview with FXStreet, RAAC CEO Kevin Rusher explains how tokenized Gold assets could impact the next crypto market recovery phase.

Read more
Five Fundamentals for the week: Fed leads central bank parade as uncertainty remains extreme

Five Fundamentals for the week: Fed leads central bank parade as uncertainty remains extreme Premium

Central bank bonanza – perhaps its is not as exciting as comments from the White House, but central banks still have sway. They have a chance to share insights about the impact of tariffs, especially when they come from the world's most powerful central bank, the Fed.  

Read more
The Best brokers to trade EUR/USD

The Best brokers to trade EUR/USD

SPONSORED Discover the top brokers for trading EUR/USD in 2025. Our list features brokers with competitive spreads, fast execution, and powerful platforms. Whether you're a beginner or an expert, find the right partner to navigate the dynamic Forex market.

Read More

Forex MAJORS

Cryptocurrencies

Signatures

Best Brokers of 2025