• USD/CHF extends its rally to four straight days, refreshed seven-week highs.
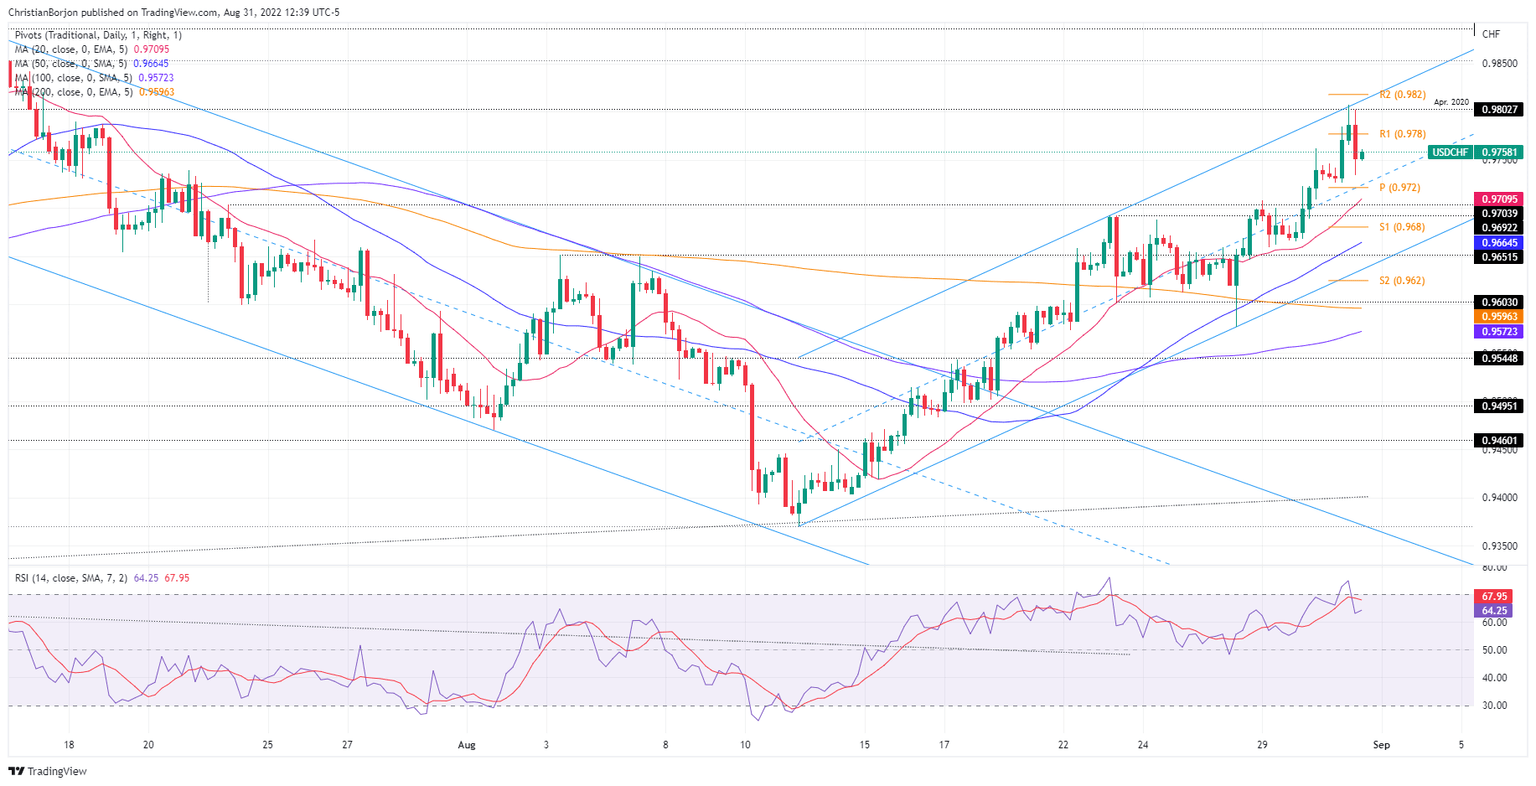
  • Solid resistance lies around the confluence of a top-trendline of an ascending channel and a psychological price level of around 0.9800.
The USD/CHF advances sharply after hitting a daily low at 0.9726. in the North American session. The USD/CHF is trading at 0.9758 after hitting a seven-week high at 0.9807.

USD/CHF Price Analysis: Technical outlook

During the day, the USD/CHF printed a seven-week high, above the 0.9800 figure, though it was short-lived. The major retreated toward current exchange rates. Nevertheless, oscillators, particularly the Relative Strength Index (RSI), signal buyers still have some fuel left in the tank to re-test the abovementioned level, which, once cleared, could pave the way towards July 14 swings high at 0.9886.

Otherwise, the USD/CHF might consolidate around the 0.9700-0.9800 range ahead of the release of Swiss CPI figures on Thursday and Friday’s US Nonfarm Payrolls.

Short term, the USD/CHF 4-hour chart depicts the pair trending up in an ascending channel. The high of the day was the second test of the top-trendline of the channel, with sellers stepping in, dragging the major 50 pips lower. USD/CHF traders should note that the high of the day, was reached when the Relative Strength Index (RSI) peaked at overbought conditions. Therefore, once the RSI dipped, then a re-test of the 0.9800 figure is on the cards.

The USD/CHF first resistance would be the R1 pivot at 0.9777. Once cleared, the next supply zone would be the figure and top-trendline of the channel around 0.9800. On the flip side, the USD/CHF first support would be the daily pivot at 0.9722. A breach of the latter will send the major tumbling towards the 20 EMA at 0.9709, followed by the 0.9700 mark.

USD/CHF Key Technical Levels

USD/CHF

Overview
Today last price 0.9755
Today Daily Change 0.0011
Today Daily Change % 0.11
Today daily open 0.9744
 
Trends
Daily SMA20 0.9572
Daily SMA50 0.9622
Daily SMA100 0.967
Daily SMA200 0.9454
 
Levels
Previous Daily High 0.9762
Previous Daily Low 0.9666
Previous Weekly High 0.9692
Previous Weekly Low 0.9574
Previous Monthly High 0.9886
Previous Monthly Low 0.9502
Daily Fibonacci 38.2% 0.9725
Daily Fibonacci 61.8% 0.9703
Daily Pivot Point S1 0.9686
Daily Pivot Point S2 0.9628
Daily Pivot Point S3 0.9589
Daily Pivot Point R1 0.9782
Daily Pivot Point R2 0.982
Daily Pivot Point R3 0.9878


Share: Feed news

Information on these pages contains forward-looking statements that involve risks and uncertainties. Markets and instruments profiled on this page are for informational purposes only and should not in any way come across as a recommendation to buy or sell in these assets. You should do your own thorough research before making any investment decisions. FXStreet does not in any way guarantee that this information is free from mistakes, errors, or material misstatements. It also does not guarantee that this information is of a timely nature. Investing in Open Markets involves a great deal of risk, including the loss of all or a portion of your investment, as well as emotional distress. All risks, losses and costs associated with investing, including total loss of principal, are your responsibility. The views and opinions expressed in this article are those of the authors and do not necessarily reflect the official policy or position of FXStreet nor its advertisers. The author will not be held responsible for information that is found at the end of links posted on this page.

If not otherwise explicitly mentioned in the body of the article, at the time of writing, the author has no position in any stock mentioned in this article and no business relationship with any company mentioned. The author has not received compensation for writing this article, other than from FXStreet.

FXStreet and the author do not provide personalized recommendations. The author makes no representations as to the accuracy, completeness, or suitability of this information. FXStreet and the author will not be liable for any errors, omissions or any losses, injuries or damages arising from this information and its display or use. Errors and omissions excepted.

The author and FXStreet are not registered investment advisors and nothing in this article is intended to be investment advice.

Recommended content


Recommended content

Editors’ Picks

EUR/USD trades around 1.0250, awaits US PPI data

EUR/USD trades around 1.0250, awaits US PPI data

EUR/USD halts its five-day losing streak, trading around 1.0250 in Tuesday's European trading hours. A broadly stable US Dollar and a positive risk sentiment leave the pair gyrating in a familiar range as traders await the US PPI inflation data and Fedspeak for fresh trading impetus. 

EUR/USD News
GBP/USD defends 1.2200 amid upbeat mood

GBP/USD defends 1.2200 amid upbeat mood

GBP/USD holds the reobund just above 1.2200 early Tuesday, having hit a 15-month low of 1.2100 on Monday. The Pound Sterling gains ground amid improved investor sentiment and a broadly subdued US Dollar. The next move in the pair will remain at the mercy of the US PPI data. 

GBP/USD News
Gold price sticks to modest intraday gains; lacks bullish conviction amid risk-on mood

Gold price sticks to modest intraday gains; lacks bullish conviction amid risk-on mood

Gold price regains positive traction amid a modest pullback in the US bond yields. Hawkish Fed expectations favor the USD bulls and should cap the precious metal. The risk-on impulse might further contribute to keeping a lid on the XAU/USD pair.

Gold News
Monero bulls remain strong, eyes double-digit gains

Monero bulls remain strong, eyes double-digit gains

Monero price trades in green around $204.92 on Tuesday after finding support around its ascending trendline the previous day. The technical outlook suggests a rally ahead as XMR’s MACD indicator shows a bullish divergence, hinting at double-digit gains.

Read more
Bitcoin falls below $92,000 as exchanges show overheating conditions

Bitcoin falls below $92,000 as exchanges show overheating conditions

Bitcoin (BTC) continues its ongoing correction, falling below $92,000 on Monday after declining almost 4% last week. CryptoQuant data shows that BTC is overheating in exchanges and suggests further decline ahead. 

Read more
Best Forex Brokers with Low Spreads

Best Forex Brokers with Low Spreads

VERIFIED Low spreads are crucial for reducing trading costs. Explore top Forex brokers offering competitive spreads and high leverage. Compare options for EUR/USD, GBP/USD, USD/JPY, and Gold.

Read More

Forex MAJORS

Cryptocurrencies

Signatures