|

USD/CHF Price Analysis: Maintains position above 0.8850, barrier at nine-day EMA

  • USD/CHF halts a losing streak on the likelihood of further policy tightening by the Fed.
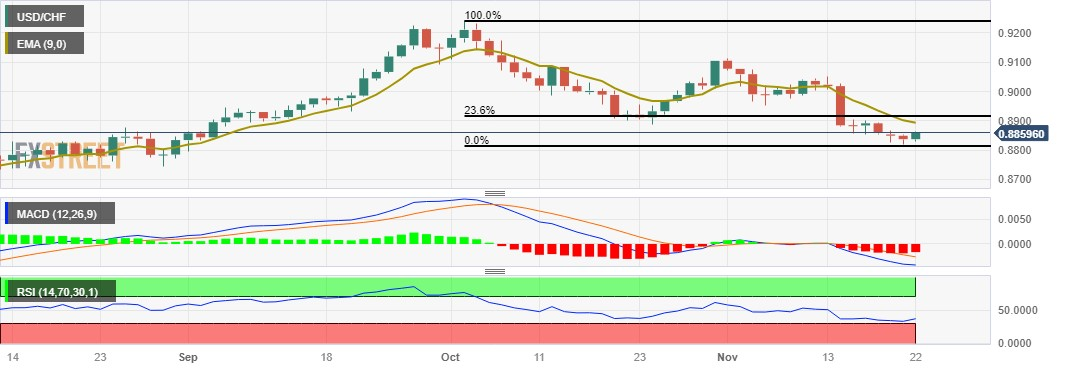
  • Nine-day EMA appears as the key barrier followed by the 0.8900 psychological level.
  • A break below the 0.8850 level could push the pair toward three-month lows.

USD/CHF snaps a three-day losing streak, edging higher near 0.8860 during the European session on Wednesday. The nine-day Exponential Moving Average (EMA) at 0.8892 emerges as the resistance aligned up with the psychological region at the 0.8900 level.

A breakthrough above the latter could open the doors for the USD/CHF pair to explore the next barrier around the 23.6% Fibonacci retracement at 0.8913 followed by the 0.8950 major level.

The Federal Open Market Committee (FOMC) meeting minutes on Tuesday suggested that additional monetary policy tightening may be necessary if new data does not reach the Federal Reserve's (Fed) inflation target, which may be the reason why the USD/CHF pair has gained strength. Until there is evident and consistent progress toward the Committee's inflation target, the Board resolved to stick to its strict stance.

However, the technical indicators for the USD/CHF pair support the current downward trend. The 14-day Relative Strength Index (RSI) below 50 indicates bearish sentiment, indicating that the pair is losing momentum.

Furthermore, the Moving Average Convergence Divergence (MACD) line is below the centerline, with divergence below the signal line, indicating that the USD/CHF pair could re-test the major support at the 0.8850 level. If there is a break below the level, the pair could navigate the area around the psychological level at 0.8800, nearing the three-month low at 0.8795.

USD/CHF: Daily Chart

USD/CHF: more technical levels to watch

Overview
Today last price0.8856
Today Daily Change0.0019
Today Daily Change %0.22
Today daily open0.8837
 
Trends
Daily SMA200.8975
Daily SMA500.9018
Daily SMA1000.8897
Daily SMA2000.8988
 
Levels
Previous Daily High0.8852
Previous Daily Low0.882
Previous Weekly High0.9052
Previous Weekly Low0.8853
Previous Monthly High0.9244
Previous Monthly Low0.8888
Daily Fibonacci 38.2%0.8832
Daily Fibonacci 61.8%0.8839
Daily Pivot Point S10.8821
Daily Pivot Point S20.8804
Daily Pivot Point S30.8788
Daily Pivot Point R10.8853
Daily Pivot Point R20.8868
Daily Pivot Point R30.8885

Author

Akhtar Faruqui

Akhtar Faruqui is a Forex Analyst based in New Delhi, India. With a keen eye for market trends and a passion for dissecting complex financial dynamics, he is dedicated to delivering accurate and insightful Forex news and analysis.

More from Akhtar Faruqui
Share:

Markets move fast. We move first.

Orange Juice Newsletter brings you expert driven insights - not headlines. Every day on your inbox.

By subscribing you agree to our Terms and conditions.

Editor's Picks

EUR/USD clings to small gains near 1.1750

Following a short-lasting correction in the early European session, EUR/USD regains its traction and clings to moderate gains at around 1.1750 on Monday. Nevertheless, the pair's volatility remains low, with investors awaiting this weeks key data releases from the US and the ECB policy announcements.

GBP/USD edges higher toward 1.3400 ahead of US data and BoE

GBP/USD reverses its direction and advances toward 1.3400 following a drop to the 1.3350 area earlier in the day. The US Dollar struggles to gather recovery momentum as markets await Tuesday's Nonfarm Payrolls data, while the Pound Sterling holds steady ahead of the BoE policy announcements later in the week.

Gold stuck around $4,300 as markets turn cautious

Gold loses its bullish momentum and retreats below $4,350 after testing this level earlier on Monday. XAU/USD, however, stays in positive territory as the US Dollar remains on the back foot on growing expectations for a dovish Fed policy outlook next year.

Solana consolidates as spot ETF inflows near $1 billion signal institutional dip-buying

Solana price hovers above $131 at the time of writing on Monday, nearing the upper boundary of a falling wedge pattern, awaiting a decisive breakout. On the institutional side, demand for spot Solana Exchange-Traded Funds remained firm, pushing total assets under management to nearly $1 billion since launch. 

Big week ends with big doubts

The S&P 500 continued to push higher yesterday as the US 2-year yield wavered around the 3.50% mark following a Federal Reserve (Fed) rate cut earlier this week that was ultimately perceived as not that hawkish after all. The cut is especially boosting the non-tech pockets of the market.

Solana Price Forecast: SOL consolidates as spot ETF inflows near $1 billion signal institutional dip-buying

Solana (SOL) price hovers above $131 at the time of writing on Monday, nearing the upper boundary of a falling wedge pattern, awaiting a decisive breakout.