|

USD/CHF Price Analysis: Looks to approach 0.8850 near monthly lows

  • USD/CHF remains below the psychological barrier at 0.8900.
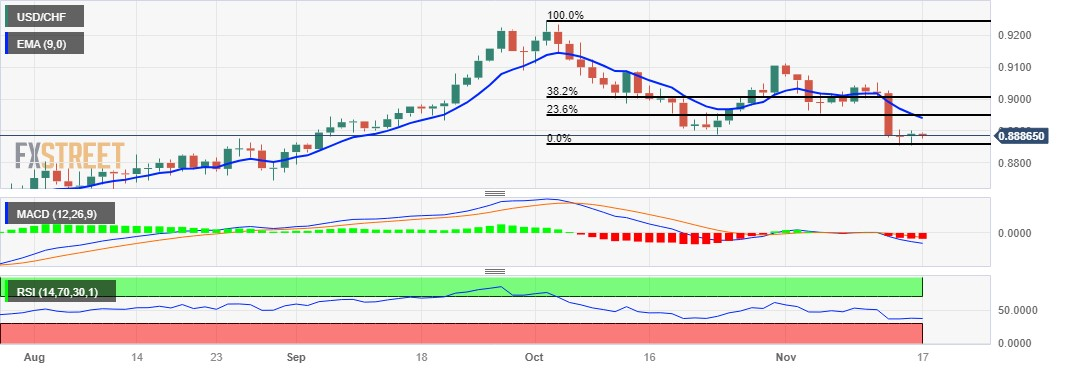
  • Technical indicators suggest a weaker momentum for the pair.
  • A firm break above the nine-day EMA could help the pair to reach the 38.2% Fibonacci retracement.

USD/CHF seems to retrace the recent gains, trading around 0.8880 during the European session on Friday. The pair could find immediate support around the major level at 0.8850 lined up with the monthly low at 0.8854.

A decisive break below the level could push the USD/CHF pair toward the psychological level at 0.8800 with the conjunction at September’s low at 0.8795.

The ongoing downward trend is backed by the technical indicators for the USD/CHF pair. The 14-day Relative Strength Index (RSI) below the 50 level signals downward pressure, indicating a weaker momentum for the pair.

Furthermore, the Moving Average Convergence Divergence (MACD) line below the centerline, with divergence below the signal line, suggests a bearish momentum in the USD/CHF pair.

On the upside, the psychological level of 0.8900 emerges as the immediate resistance followed by the nine-day Exponential Moving Average (EMA) at 0.8939 aligned with the 23.6% Fibonacci retracement at 0.8947.

A firm breakthrough above the latter could support the bulls of the USD/CHF pair to approach the region around the 38.2% Fibonacci retracement at 0.9004.

USD/CHF: Daily Chart

USD/CHF: other technical levels

Overview
Today last price0.8877
Today Daily Change-0.0014
Today Daily Change %-0.16
Today daily open0.8891
 
Trends
Daily SMA200.8986
Daily SMA500.9022
Daily SMA1000.89
Daily SMA2000.8994
 
Levels
Previous Daily High0.89
Previous Daily Low0.8855
Previous Weekly High0.9046
Previous Weekly Low0.8954
Previous Monthly High0.9244
Previous Monthly Low0.8888
Daily Fibonacci 38.2%0.8883
Daily Fibonacci 61.8%0.8872
Daily Pivot Point S10.8864
Daily Pivot Point S20.8836
Daily Pivot Point S30.8818
Daily Pivot Point R10.8909
Daily Pivot Point R20.8928
Daily Pivot Point R30.8955

Author

Akhtar Faruqui

Akhtar Faruqui is a Forex Analyst based in New Delhi, India. With a keen eye for market trends and a passion for dissecting complex financial dynamics, he is dedicated to delivering accurate and insightful Forex news and analysis.

More from Akhtar Faruqui
Share:

Editor's Picks

EUR/USD slumps below 1.1750 as USD benefits from risk-aversion

EUR/USD comes under renewed bearish pressure in the European session and trades below 1.1750 following a recovery attempt earlier in the day. The US Dollar gathers strength and weighs on the pair as investors seek refuge in the wake of Israel and the United States' joint attack on Iran.

GBP/USD targets 1.3500 barrier near moving averages

GBP/USD rebounds from the daily losses, trading around 1.3450 during the Asian hours on Monday. The technical analysis of the daily chart indicates an ongoing bearish bias, as the pair trades within a descending channel pattern.

Gold surges on safe-haven demand, rises above $5,400

Gold benefits from intense risk-aversion on Monday and climbs above $5,400, setting a fresh monthly-high in the process. Tensions in the Middle East remain high as Israel and Hezbollah continue to exchange strikes following the US-Israel joint attack on Iran over the weekend.

Bitcoin, Ethereum and Ripple under pressure as key supports face breakdown risk

Bitcoin, Ethereum, and Ripple prices trade on the back foot at the start of this week on Monday, after extending losses in the previous week. BTC is on the brink of a breakdown, ETH is capped below key resistance, and XRP risks a crack of the trendline.

The market is paying for insurance, not apocalypse

As expected, this morning felt less like a Monday market open and more like a fire drill. Futures screens flickered red. S&P contracts down almost 1%. Nasdaq off 1.2%. Brent leaped 13% through $80. Gold rose 1.6% toward $5350 before paring some gains. The dollar is strutting mildly. The Swiss franc is quietly doing what it always does in a storm, catching some safe-haven flows.

Pi Network Price Forecast: Core team offloads supply, weighing on PI recovery

Pi Network  hovers below $0.1700, broadly steady at press time on Monday, attempting a recovery after a 2% loss the previous day. Sunday’s decline aligned with nearly 49 million PI tokens offloaded by the Pi Foundation, implying a spike in supply pressure that capped the prevailing four-day recovery.