|

USD/CHF Price Analysis: Looks set to reclaim 0.9000 mark as SNB vs. Fed divergence looms

  • USD/CHF prints four-day uptrend within short-term bullish chart pattern.
  • 200-HMA prods Swiss Franc sellers inside the rising channel.
  • Previous resistance line, 100-HMA act as extra filter towards the south.
  • SNB’s anticipated rate hike jostles with Fed’s hawkish halt to lure buyers.

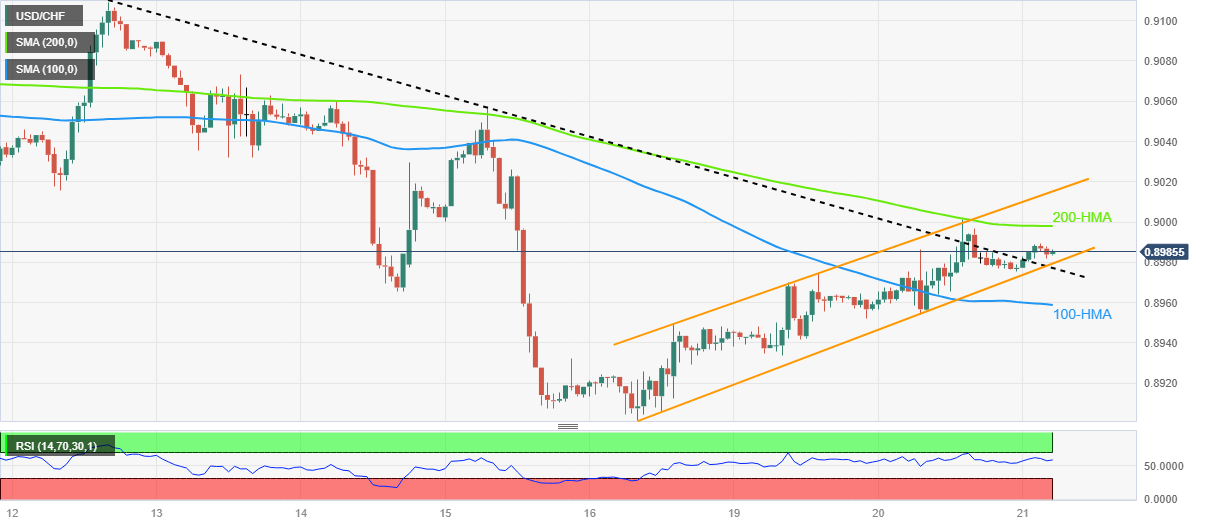
USD/CHF prints mild gains around 0.8990 as it remains firmer for the fourth consecutive day heading into Wednesday’s European session. In doing so, the Swiss Franc (CHF) pair seesaws inside an upward-sloping trend channel stretched from the last Friday.

Apart from the bullish chart pattern, the upbeat RSI (14) line and the pair’s successful trading beyond the 100-Hour Moving Average (HMA) also keep the USD/CHF pair buyers hopeful.

Even so, the likely divergence between the monetary policy practice between the Swiss National Bank (SNB) and the Federal Reserve (Fed) prods USD/CHF pair buyers ahead of Fed Chair Jerome Powell’s bi-annual testimony and SNB Interest Rate Decision, up for publishing on Wednesday and Thursday respectively.

That said, the 200-HMA hurdle surrounding the 0.9000 psychological magnet restricts the immediate upside of the USD/CHF pair ahead of the stated channel’s top line, close to 0.9020 by the press time.

In a case where the Swiss Franc pair remains firmer past 0.9020, multiple levels around 0.9050-55 can prod the bulls ahead of directing them towards the monthly high of near 0.9120.

Meanwhile, the stated channel’s bottom line, near 0.8980, restricts the immediate downside of the pair ahead of the resistance-turned-support stretched from June 12, close to 0.8975.

Following that, the 100-HMA level of around 0.8958 will act as the last defense of the buyers before highlighting the monthly low marked the last Friday at around 0.8900.

USD/CHF: Hourly chart

Trend: Further recovery expected

Additional important levels

Overview
Today last price0.8985
Today Daily Change0.0007
Today Daily Change %0.08%
Today daily open0.8978
 
Trends
Daily SMA200.9036
Daily SMA500.8979
Daily SMA1000.9105
Daily SMA2000.9333
 
Levels
Previous Daily High0.9001
Previous Daily Low0.8952
Previous Weekly High0.9109
Previous Weekly Low0.8902
Previous Monthly High0.9148
Previous Monthly Low0.882
Daily Fibonacci 38.2%0.8982
Daily Fibonacci 61.8%0.8971
Daily Pivot Point S10.8953
Daily Pivot Point S20.8928
Daily Pivot Point S30.8905
Daily Pivot Point R10.9002
Daily Pivot Point R20.9026
Daily Pivot Point R30.9051

Author

Anil Panchal

Anil Panchal

FXStreet

Anil Panchal has nearly 15 years of experience in tracking financial markets. With a keen interest in macroeconomics, Anil aptly tracks global news/updates and stays well-informed about the global financial moves and their implications.

More from Anil Panchal
Share:

Markets move fast. We move first.

Orange Juice Newsletter brings you expert driven insights - not headlines. Every day on your inbox.

By subscribing you agree to our Terms and conditions.

Editor's Picks

EUR/USD clings to small gains near 1.1750

Following a short-lasting correction in the early European session, EUR/USD regains its traction and clings to moderate gains at around 1.1750 on Monday. Nevertheless, the pair's volatility remains low, with investors awaiting this weeks key data releases from the US and the ECB policy announcements.

GBP/USD edges higher toward 1.3400 ahead of US data and BoE

GBP/USD reverses its direction and advances toward 1.3400 following a drop to the 1.3350 area earlier in the day. The US Dollar struggles to gather recovery momentum as markets await Tuesday's Nonfarm Payrolls data, while the Pound Sterling holds steady ahead of the BoE policy announcements later in the week.

Gold pulls away from session high, holds above $4,300

Gold loses its bullish momentum and retreats below $4,350 after testing this level earlier on Monday. XAU/USD, however, stays in positive territory as the US Dollar remains on the back foot on growing expectations for a dovish Fed policy outlook next year.

Solana consolidates as spot ETF inflows near $1 billion signal institutional dip-buying

Solana price hovers above $131 at the time of writing on Monday, nearing the upper boundary of a falling wedge pattern, awaiting a decisive breakout. On the institutional side, demand for spot Solana Exchange-Traded Funds remained firm, pushing total assets under management to nearly $1 billion since launch. 

Big week ends with big doubts

The S&P 500 continued to push higher yesterday as the US 2-year yield wavered around the 3.50% mark following a Federal Reserve (Fed) rate cut earlier this week that was ultimately perceived as not that hawkish after all. The cut is especially boosting the non-tech pockets of the market.

Solana Price Forecast: SOL consolidates as spot ETF inflows near $1 billion signal institutional dip-buying

Solana (SOL) price hovers above $131 at the time of writing on Monday, nearing the upper boundary of a falling wedge pattern, awaiting a decisive breakout.