- USD/CHF bounces from weekly lows, set to finish the week with gains of 0.73%.
- From a daily chart perspective, the USD/CHF has nowhere to go; it would likely remain in consolidation.
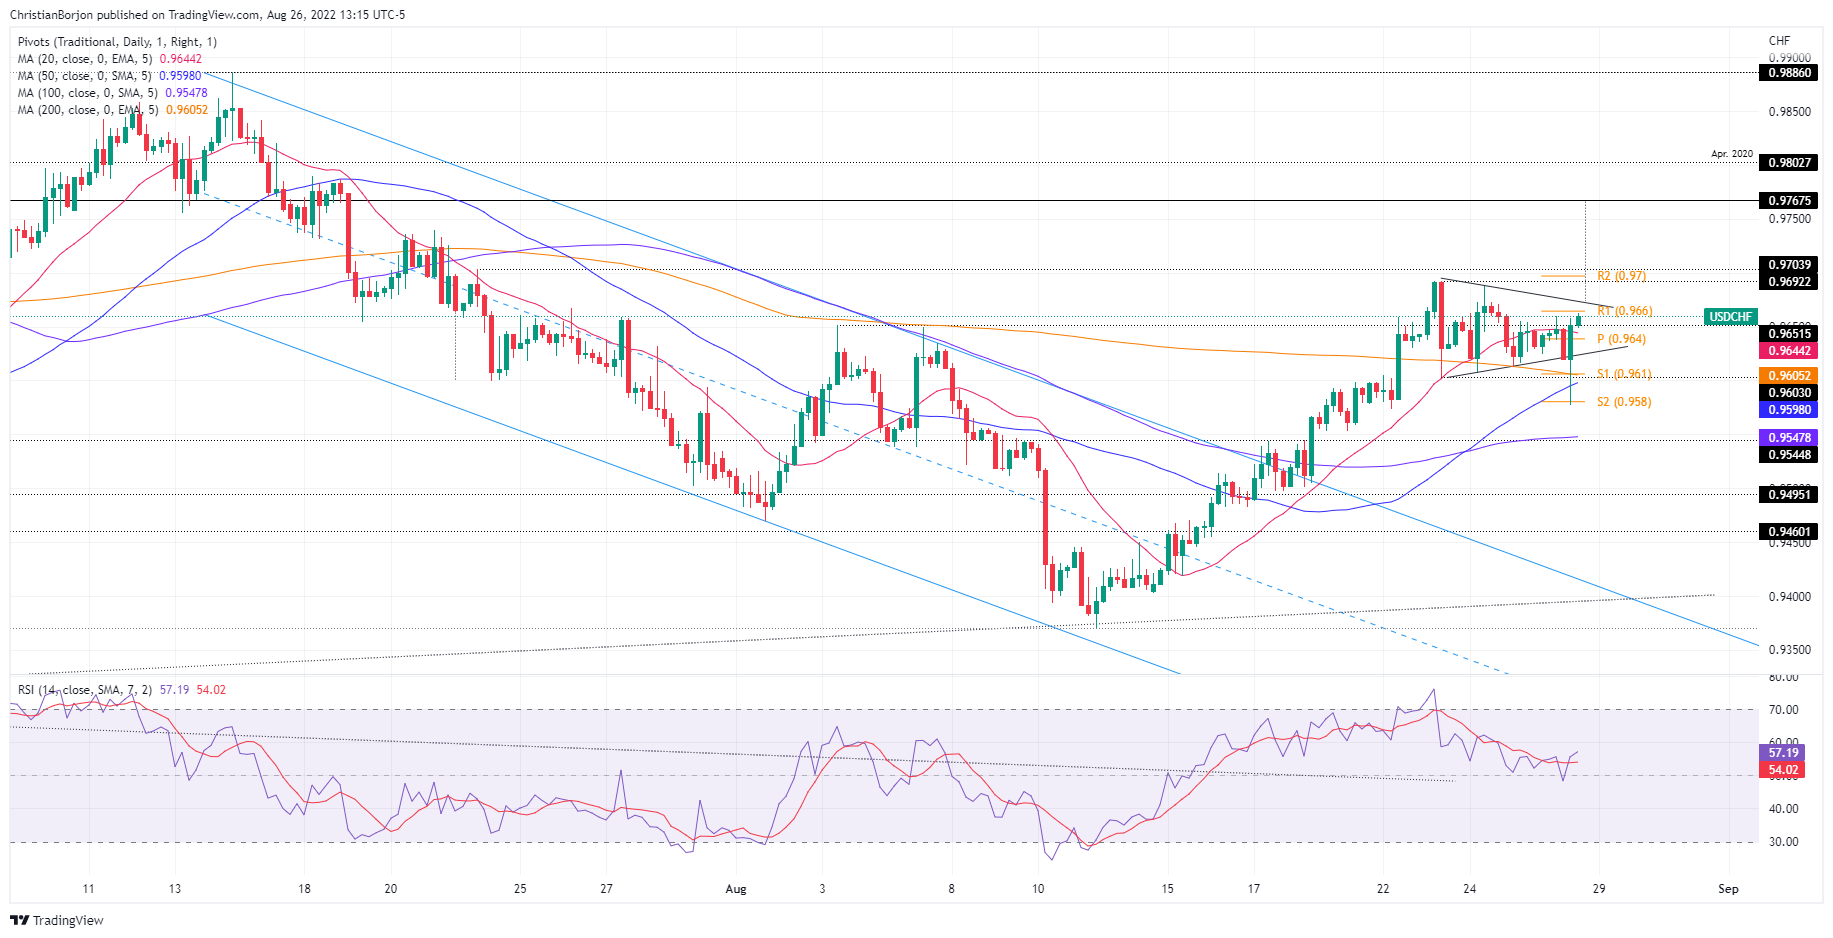
- Near-term, a symmetrical triangle in the USD/CHF 4-hour chart targets 0.9767.
The USD/CHF stages a comeback after hitting weekly lows around 0.9577 earlier in the day and is about to erase Thursday’s losses as the USD/CHF aims towards the 100-DMA, following hawkish remarks by the US Federal Reserve Chief, Jerome Powell. The USD/CHF is trading at 0.9659, up by almost 0.20%.
USD/CHF Price Analysis: Technical outlook
Consolidation in the daily chart will keep the USD/CHF trading within the 0.9600-0.9690 range, as shown by this week’s price action. Worth noting that the support/resistance levels are the 100 and 50-day EMAs, each at 0.9657 and 0.9614, respectively. Therefore, unless the exchange rate decisively breaks above/below the range, the USD/CHF might remain subdued.
Short term, the USD/CHF 4-hour scale depicts the formation of a symmetrical triangle on an uptrend, which was “false” broken to the downside, on the remarks of Fed’s Powell, though it closed within the top-bottom of the trendlines. Additionally, the USD/CHF bias is neutral-to-upwards biased, confirmed by the moving averages residing below the spot price, while the Relative Strength Index (RSI) turned the coroner and began to aim higher in positive territory.
Hence, the USD/CHF first resistance would be the top-trendline of the symmetrical triangle. Break above will expose the confluence of the R2 pivot point and the 0.9700 figure. Once cleared, the next supply zone would be the height of the symmetrical triangle, which targets 0.9767, followed by the psychological 0.9800 mark.
USD/CHF Key Technical Levels
Information on these pages contains forward-looking statements that involve risks and uncertainties. Markets and instruments profiled on this page are for informational purposes only and should not in any way come across as a recommendation to buy or sell in these assets. You should do your own thorough research before making any investment decisions. FXStreet does not in any way guarantee that this information is free from mistakes, errors, or material misstatements. It also does not guarantee that this information is of a timely nature. Investing in Open Markets involves a great deal of risk, including the loss of all or a portion of your investment, as well as emotional distress. All risks, losses and costs associated with investing, including total loss of principal, are your responsibility. The views and opinions expressed in this article are those of the authors and do not necessarily reflect the official policy or position of FXStreet nor its advertisers. The author will not be held responsible for information that is found at the end of links posted on this page.
If not otherwise explicitly mentioned in the body of the article, at the time of writing, the author has no position in any stock mentioned in this article and no business relationship with any company mentioned. The author has not received compensation for writing this article, other than from FXStreet.
FXStreet and the author do not provide personalized recommendations. The author makes no representations as to the accuracy, completeness, or suitability of this information. FXStreet and the author will not be liable for any errors, omissions or any losses, injuries or damages arising from this information and its display or use. Errors and omissions excepted.
The author and FXStreet are not registered investment advisors and nothing in this article is intended to be investment advice.


Recommended content
Editors’ Picks

EUR/USD remains offered in the low-1.0900s
The generalised selling pressure continues to weigh on the risk complex, pushing EUR/USD back toward the 1.0900 support level amid a growing risk-off mood, as traders assess President Trump’s reciprocal tariffs and their impact on economic activity.

GBP/USD retreats further and breaks below 1.2800
The US Dollar is picking up extra pace and flirting with daily highs, sending GBP/USD to multi-week lows near 1.2770 in a context where safe-haven demand continues to dictate sentiment amid the chaos of US tariffs.

Gold slips back below the $3,000 mark
Gold has turned lower, slipping beneath the key $3,000 mark per troy ounce amid a broad sell-off across global equity markets. The decline in the precious metal may reflect investors unwinding long positions in gold to offset mounting losses in stocks.

US stock market suddenly reverses higher after rumor of 90-day tariff pause before sinking again Premium
NASDAQ sinks 4% before shooting higher on tariff pause rumor. CNBC says White House unaware of tariff pause rumor. S&P 500 sinks to January 2024 level. Bank of America cuts its year-end target for S&P 500 by 16%.

Strategic implications of “Liberation Day”
Liberation Day in the United States came with extremely protectionist and inward-looking tariff policy aimed at just about all U.S. trading partners. In this report, we outline some of the more strategic implications of Liberation Day and developments we will be paying close attention to going forward.

The Best brokers to trade EUR/USD
SPONSORED Discover the top brokers for trading EUR/USD in 2025. Our list features brokers with competitive spreads, fast execution, and powerful platforms. Whether you're a beginner or an expert, find the right partner to navigate the dynamic Forex market.