|

USD/CHF Price Analysis: Holds below the 0.9200 mark amid overbought condition, Swiss data eyed

  • USD/CHF gains momentum around 0.9165, the highest since April.
  • The overbought RSI condition indicates that further consolidation cannot be ruled out.
  • A psychological round mark at 0.9200 is the first resistance level; 0.9128 acts as an initial support level.

The USD/CHF pair holds positive ground for seven straight days during the early European session on Wednesday. As of writing, USD/CHF is up 0.09% on the day at 0.9165. Market participants await the Swiss ZEW Survey and Swiss National Bank (SNB) Quarterly Bulletin on Wednesday for fresh impetus ahead of the US consumer inflation on Friday.

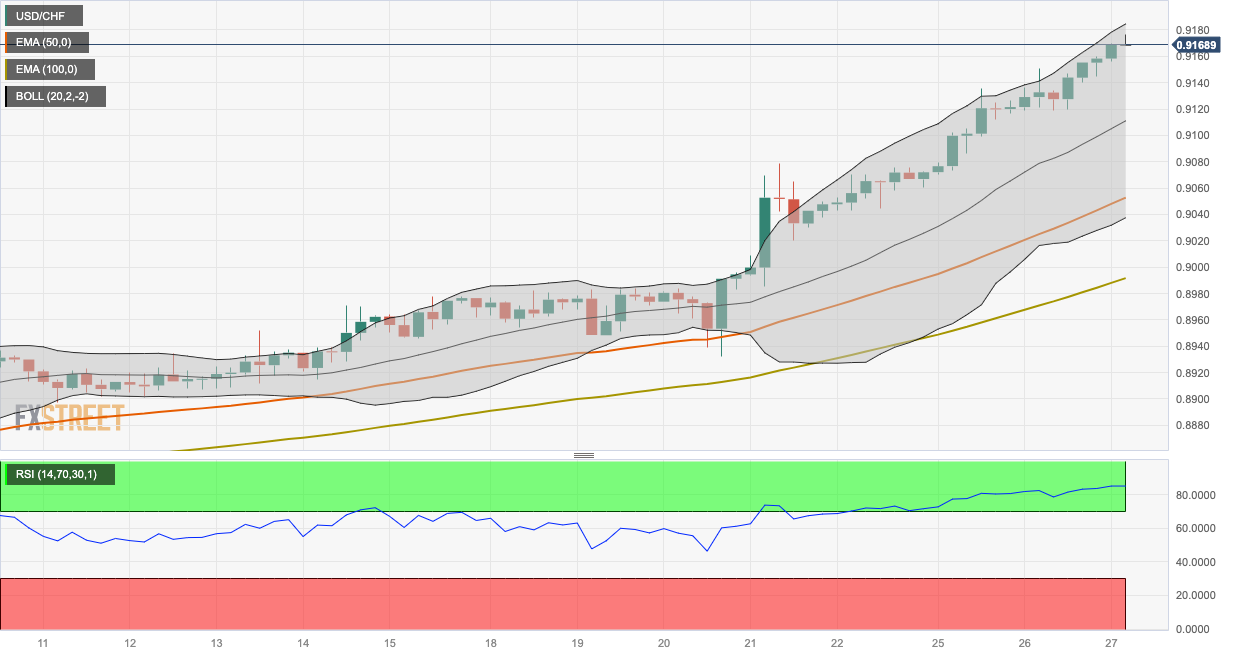
Technically, USD/CHF holds above the 50- and 100-hour Exponential Moving Averages (EMAs) with an upward slope on the four-hour chart. This indicates that the path of least resistance for the pair is to the upside. The Relative Strength Index (RSI) holds in bullish territory above 50. However, the overbought RSI condition indicates that further consolidation cannot be ruled out before positioning for any near-term USD/CHF appreciation.

The first resistance level for USD/CHF is located at 0.9200, representing a psychological round figure and a high of March 30. A break above the latter will see a rally to 0.9245 (a high of March 22) en route to 0.9300 (a high of March 17 and round figure).
Looking at the downside, a low of September 26 at 0.9128 acts as an initial support level for USD/CHF. Further south, the next stop is seen near the 50-hour EMA at 0.9053. Any intraday pullback below the latter would expose the next contention at 0.9035 (the lower limit of the Bollinger Band), followed by 0.8990 (the 100-hour EMA).

USD/CHF four-hour chart

USD/CHF

Overview
Today last price0.9173
Today Daily Change0.0015
Today Daily Change %0.16
Today daily open0.9158
 
Trends
Daily SMA200.895
Daily SMA500.8828
Daily SMA1000.889
Daily SMA2000.9033
 
Levels
Previous Daily High0.9159
Previous Daily Low0.9117
Previous Weekly High0.9078
Previous Weekly Low0.8932
Previous Monthly High0.8876
Previous Monthly Low0.869
Daily Fibonacci 38.2%0.9143
Daily Fibonacci 61.8%0.9133
Daily Pivot Point S10.913
Daily Pivot Point S20.9102
Daily Pivot Point S30.9088
Daily Pivot Point R10.9172
Daily Pivot Point R20.9187
Daily Pivot Point R30.9215

Author

Lallalit Srijandorn

Lallalit Srijandorn is a Parisian at heart. She has lived in France since 2019 and now becomes a digital entrepreneur based in Paris and Bangkok.

More from Lallalit Srijandorn
Share:

Markets move fast. We move first.

Orange Juice Newsletter brings you expert driven insights - not headlines. Every day on your inbox.

By subscribing you agree to our Terms and conditions.

Editor's Picks

EUR/USD clings to small gains near 1.1750

Following a short-lasting correction in the early European session, EUR/USD regains its traction and clings to moderate gains at around 1.1750 on Monday. Nevertheless, the pair's volatility remains low, with investors awaiting this weeks key data releases from the US and the ECB policy announcements.

GBP/USD edges higher toward 1.3400 ahead of US data and BoE

GBP/USD reverses its direction and advances toward 1.3400 following a drop to the 1.3350 area earlier in the day. The US Dollar struggles to gather recovery momentum as markets await Tuesday's Nonfarm Payrolls data, while the Pound Sterling holds steady ahead of the BoE policy announcements later in the week.

Gold pulls away from session high, holds above $4,300

Gold loses its bullish momentum and retreats below $4,350 after testing this level earlier on Monday. XAU/USD, however, stays in positive territory as the US Dollar remains on the back foot on growing expectations for a dovish Fed policy outlook next year.

Solana consolidates as spot ETF inflows near $1 billion signal institutional dip-buying

Solana price hovers above $131 at the time of writing on Monday, nearing the upper boundary of a falling wedge pattern, awaiting a decisive breakout. On the institutional side, demand for spot Solana Exchange-Traded Funds remained firm, pushing total assets under management to nearly $1 billion since launch. 

Big week ends with big doubts

The S&P 500 continued to push higher yesterday as the US 2-year yield wavered around the 3.50% mark following a Federal Reserve (Fed) rate cut earlier this week that was ultimately perceived as not that hawkish after all. The cut is especially boosting the non-tech pockets of the market.

Solana Price Forecast: SOL consolidates as spot ETF inflows near $1 billion signal institutional dip-buying

Solana (SOL) price hovers above $131 at the time of writing on Monday, nearing the upper boundary of a falling wedge pattern, awaiting a decisive breakout.