|

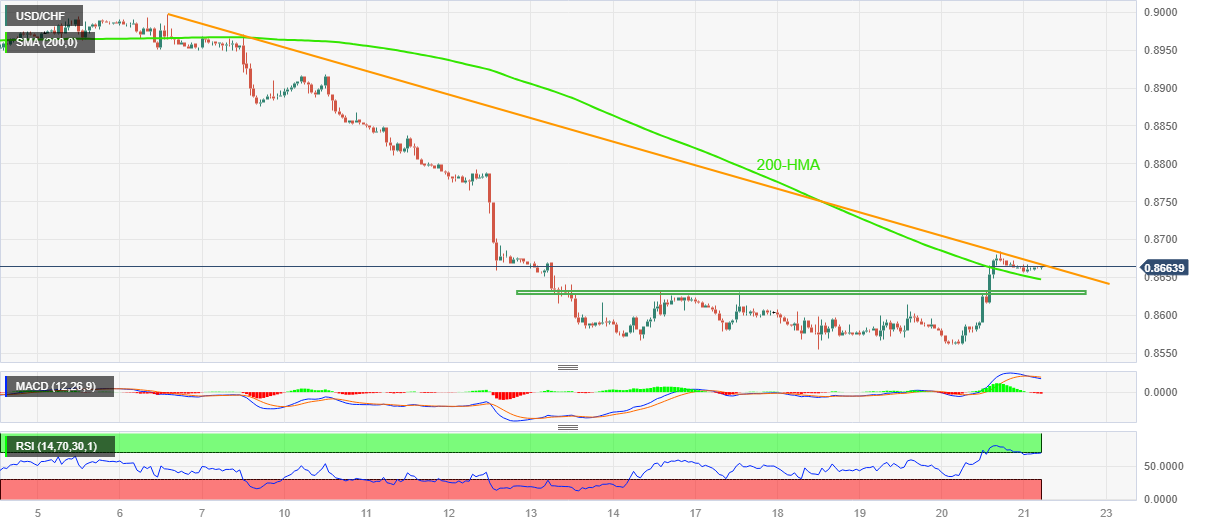
USD/CHF Price Analysis: Grinds between 200-HMA and fortnight-old resistance line below 0.8700

  • USD/CHF edges higher during the first positive week, so far, in four despite snapping two-day uptrend.
  • Overbought RSI, bearish MACD signals join short-term key resistance line to challenge pair buyers.
  • 200-HMA, one-week-old horizontal region provide headwinds to Swiss Franc pair sellers.

USD/CHF treads water as it seesaws within a small trading range of around 15 pips above 0.8655 heading into Friday’s European session.

In doing so, the Swiss Franc (CHF) pair remains sidelined between the 200-Hour Moving Average (HMA) and a two-week-long downward-sloping resistance line. With this, the major currency pair braces for the first weekly gain in four, despite snapping a two-day winning streak with mild losses of late.

It’s worth noting that the overbought RSI and bearish MACD signals suggest the market favors the USD/CHF sellers. However, a clear break of the 200-HMA level of 0.8647 becomes necessary to convince the bears.

Even so, a horizontal area comprising multiple levels marked since July 13, close to 0.8630-25, can challenge the USD/CHF sellers before directing them to the multi-year low marked earlier in the week around 0.8555. During the likely fall, the 0.8600 round figure may act as an intermediate halt.

Meanwhile, an upside clearance of the falling resistance line stretched from July 06, near 0.8670 at the latest, will need validation from the weekly high of around 0.8685, as well as the 0.8700 round figure to convince USD/CHF buyers.

In a case where the USD/CHF stays firmer past 0.8700, the July 12 swing high of near 0.8795 and the 0.8800 will be on the bull’s radar.

USD/CHF: Hourly chart

Trend: Pullback expected

Additional important levels

Overview
Today last price0.8663
Today Daily Change-0.0004
Today Daily Change %-0.05%
Today daily open0.8667
 
Trends
Daily SMA200.8825
Daily SMA500.8941
Daily SMA1000.9009
Daily SMA2000.9225
 
Levels
Previous Daily High0.8684
Previous Daily Low0.8561
Previous Weekly High0.8918
Previous Weekly Low0.8566
Previous Monthly High0.912
Previous Monthly Low0.8902
Daily Fibonacci 38.2%0.8637
Daily Fibonacci 61.8%0.8608
Daily Pivot Point S10.8591
Daily Pivot Point S20.8514
Daily Pivot Point S30.8467
Daily Pivot Point R10.8714
Daily Pivot Point R20.8761
Daily Pivot Point R30.8837

Author

Anil Panchal

Anil Panchal

FXStreet

Anil Panchal has nearly 15 years of experience in tracking financial markets. With a keen interest in macroeconomics, Anil aptly tracks global news/updates and stays well-informed about the global financial moves and their implications.

More from Anil Panchal
Share:

Editor's Picks

EUR/USD struggles aroound 1.1800 as USD stabilizes

EUR/USD stays defensive around 1.1800 in the European session on Thursday. The US Dollar stabilizes, following the recent decline led by tariff uncertainty, capping the pair's upside. All eyes now remain on the US-Iran nuclear talks after ECB President Lagarde's testimony fails to impress Euro bulls. 

GBP/USD drops toward 1.3500 as USD finds fresh demand

GBP/USD falls back toward 1.3500 in the European session on Thursday, snapping its recovery momentum. The pair loses traction as the US Dollar finds fresh demand, as markets turn cautious ahead of the US-Iran nuclear talks. The US trade policy uncertainty also remains a drag on risk sentiment. 

Gold clings to gains amid sustained safe-haven flows ahead of US-Iran talks

Gold sticks to its modest intraday gains through the first half of the European session on Thursday, with bulls still awaiting a sustained move and acceptance above the $5,200 mark before placing fresh bets. 

Stellar: Relief bounce fades as bearish undertone persists

Stellar is trading around $0.16 at the time of writing on Thursday after rebounding more than 8% in the previous day. Derivatives data paints a negative picture as XLM’s short bets hit a monthly high while Open Interest continues to decline.

The one thing everyone is on the lookout for is US action of some sort against Iran

The FX market is minestrone soup these days. It is befuddled by conflicting data, rumors and small stories exaggerated out of proportion, and Trump-generated uncertainty. 

Solana strikes key resistance with double-digit gains

Solana trades at $88 at press time on Thursday, after an 11% upswing the previous day within a broader consolidation range of roughly three weeks. Institutional demand for Solana heightens as US spot SOL Exchange Traded Funds record $30 million of inflow on Wednesday.