|

USD/CHF Price Analysis: Further downside past 0.8900 appears impulsive

  • USD/CHF stays pressured after reversing from one-week high the previous day.
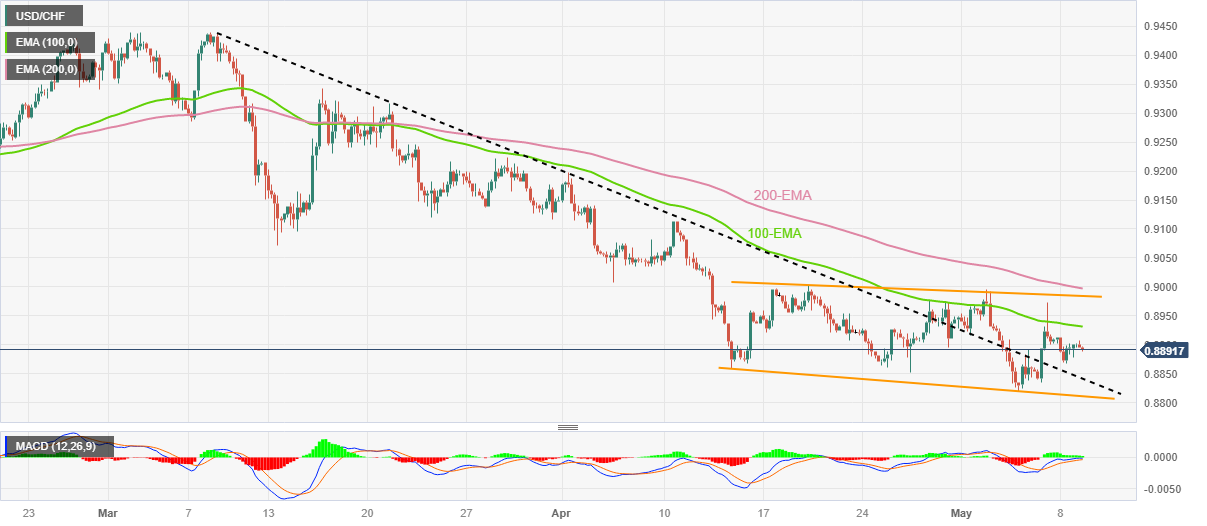
  • Failure to cross 100-EMA, easing bullish bias of MACD lures Swiss Franc buyers inside bearish megaphone formation.
  • Two-month-old previous resistance line lures intraday sellers; bulls need 200-EMA breakout to convince markets.

USD/CHF remains depressed below 0.8900, down for the second consecutive day, as it retreats from the 200-EMA hurdle heading into Tuesday’s European session.

Apart from taking a U-turn from the 200-Exponential Moving Average (EMA), the easing bullish bias of the MACD and the pair’s sustained trading within a three-week-old bearish megaphone trend-widening chart pattern also keeps the USD/CHF sellers hopeful.

That said, the Swiss Franc (CHF) pair bears may initially aim for the previous resistance line from March 08, now immediate support near 0.8840.

Following that, the stated megaphone’s bottom line, around 0.8810 at the latest, quickly followed by the 0.8800 round figure, can test the USD/CHF bears.

On the flip side, USD/CHF pair’s rebound can challenge the 100-EMA hurdle of surrounding 0.8930.

In a case where the Swiss Franc (CHF) sellers manage to keep the reins past 0.8930, the stated megaphone’s top line and the 200-EMA, respectively near 0.8980 and the 0.9000 round figure, can act as the last defense of the USD/CHF bears.

Should the USD/CHF buyers manage to hold the line after 0.9000, the mid-March low and the previous monthly high, around 0.9070 and 0.9200 in that order, should gain their attention.

Overall, USD/CHF is likely to remain pressured but the downside room appears limited.

USD/CHF: Four-hour chart

Trend: Further downside expected

Additional important levels

Overview
Today last price0.8892
Today Daily Change-0.0003
Today Daily Change %-0.03%
Today daily open0.8895
 
Trends
Daily SMA200.8929
Daily SMA500.9107
Daily SMA1000.918
Daily SMA2000.9428
 
Levels
Previous Daily High0.8912
Previous Daily Low0.8868
Previous Weekly High0.8995
Previous Weekly Low0.882
Previous Monthly High0.9198
Previous Monthly Low0.8852
Daily Fibonacci 38.2%0.8885
Daily Fibonacci 61.8%0.8895
Daily Pivot Point S10.8871
Daily Pivot Point S20.8847
Daily Pivot Point S30.8827
Daily Pivot Point R10.8916
Daily Pivot Point R20.8936
Daily Pivot Point R30.896

Author

Anil Panchal

Anil Panchal

FXStreet

Anil Panchal has nearly 15 years of experience in tracking financial markets. With a keen interest in macroeconomics, Anil aptly tracks global news/updates and stays well-informed about the global financial moves and their implications.

More from Anil Panchal
Share:

Markets move fast. We move first.

Orange Juice Newsletter brings you expert driven insights - not headlines. Every day on your inbox.

By subscribing you agree to our Terms and conditions.

Editor's Picks

EUR/USD stays defensive below 1.1750 as USD finds its feet

EUR/USD kicks off the new week on a softer note, holding below 1.1750 in European trading on Monday. The pair faces challenges due to a pause in the US Dollar downtrend, with traders shifting their focus to the delayed US Nonfarm Payrolls and CPI data for fresh directives. The ECB policy decision is also eagerly awaited. 

GBP/USD holds steady above 1.3350 as traders await key data and BoE

GBP/USD remains on the back foot above 1.3350 in the European session on Monday, though it lacks bearish conviction and holds above the key 200-day SMA support. The US Dollar holds its recovery mode ahead of key data releases, while the Pound Sterling faces headwinds from the expected BoE rate cut this week. 

Gold climbs to seven-week highs on Fed rate cut bets, safe-haven demand

Gold price rises to seven-week highs to near $4,350 during the early European trading hours on Monday. The precious metal extends its upside amid the prospect of interest rate cuts by the US Fed next year. Lower interest rates could reduce the opportunity cost of holding Gold, supporting the non-yielding precious metal.

Solana consolidates as spot ETF inflows near $1 billion signal institutional dip-buying

Solana price hovers above $131 at the time of writing on Monday, nearing the upper boundary of a falling wedge pattern, awaiting a decisive breakout. On the institutional side, demand for spot Solana Exchange-Traded Funds remained firm, pushing total assets under management to nearly $1 billion since launch. 

Big week ends with big doubts

The S&P 500 continued to push higher yesterday as the US 2-year yield wavered around the 3.50% mark following a Federal Reserve (Fed) rate cut earlier this week that was ultimately perceived as not that hawkish after all. The cut is especially boosting the non-tech pockets of the market.

Solana Price Forecast: SOL consolidates as spot ETF inflows near $1 billion signal institutional dip-buying

Solana (SOL) price hovers above $131 at the time of writing on Monday, nearing the upper boundary of a falling wedge pattern, awaiting a decisive breakout.