|

USD/CHF Price Analysis: Further downside past 0.8800 appears more impulsive

  • USD/CHF takes offers to extend week-start reversal from 1.5-month high.
  • U-turn from multi-month-old resistance line, downside break of immediate rising trend line favor Swiss Franc pair sellers.
  • 200-SMA lures short-term sellers; bulls need validation from 0.8830.

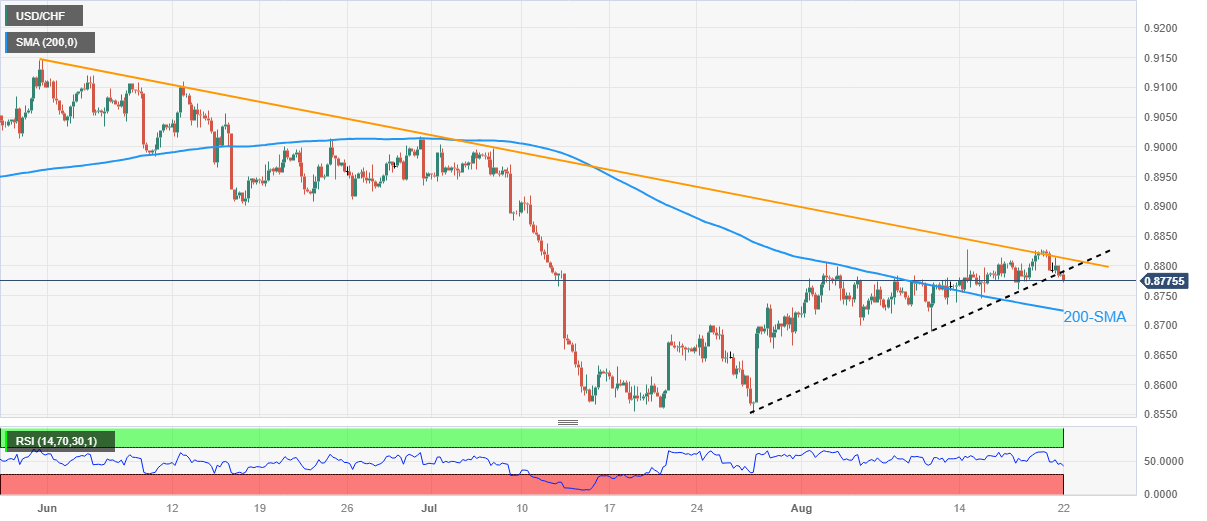
USD/CHF takes offers to extend the previous week’s U-turn from a multi-day-old resistance line amid early Tuesday, down 0.10% intraday near 0.8775 by the press time.

In doing so, the Swiss Franc (CHF) pair cheers the downside break of a one-month-long rising trend line support, now immediate resistance near 0.8790.

The trend line breakdown joins the downward-sloping RSI (14) line, not oversold, to also strengthen the bearish bias about the USD/CHF pair.

As a result, the sellers are all set to revisit the 200-SMA support of around 0.8725 before poking the 0.8700 round figure.

However, multiple levels marked during the late July highlight 0.8690 and 0.8630 will challenge the USD/CHF sellers afterward.

Meanwhile, the pair’s recovery past 0.8790 support-turned-resistance needs validation from the 0.8800 round figure and a downward-sloping resistance line from May 31, close to 0.8815 by the press time.

Following that, the double tops marked on August 14 and 21 around 0.8830 may act as the final defense of the USD/CHF bears ahead of directing the buyers toward June’s bottom surrounding 0.8900.

Overall, USD/CHF remains on the bear’s radar even if the road toward the south appears long and bumpy.

USD/CHF: Four-hour chart

Trend: Further downside expected

Additional important levels

Overview
Today last price0.8776
Today Daily Change-0.0009
Today Daily Change %-0.10%
Today daily open0.8785
 
Trends
Daily SMA200.8745
Daily SMA500.881
Daily SMA1000.8899
Daily SMA2000.9097
 
Levels
Previous Daily High0.8828
Previous Daily Low0.878
Previous Weekly High0.8828
Previous Weekly Low0.8738
Previous Monthly High0.9005
Previous Monthly Low0.8552
Daily Fibonacci 38.2%0.8798
Daily Fibonacci 61.8%0.881
Daily Pivot Point S10.8767
Daily Pivot Point S20.875
Daily Pivot Point S30.8719
Daily Pivot Point R10.8815
Daily Pivot Point R20.8846
Daily Pivot Point R30.8863

Author

Anil Panchal

Anil Panchal

FXStreet

Anil Panchal has nearly 15 years of experience in tracking financial markets. With a keen interest in macroeconomics, Anil aptly tracks global news/updates and stays well-informed about the global financial moves and their implications.

More from Anil Panchal
Share:

Editor's Picks

EUR/USD stays weak above 1.1750 ahead of German/ EU PMI data

EUR/USD remains on the back foot above 1.1850 in the European session on Friday, well within striking distance of a nearly one-month low set the previous day. Unabated US Dollar demand and nervousness ahead of the German and Eurozone business PMI data keep the pair undermined. 

GBP/USD recovers above 1.3450 after strong UK Retail Sales data

GBP/USD is recovering ground above 1.3450 in European trading on Friday, helped by a modest uptick in the Pound Sterling after a bigger-than-expected increase in the UK Retail Sales for January. However, the further upside appears limited in the pair amid persistent US Dollar strength and ahead of key UK and US data. 

Gold rises for third day on geopolitical risks, US data eyed

Gold gains some positive traction for the third consecutive day on Friday. The upside potential, however, seems limited amid the mixed fundamental backdrop. Moreover, traders might opt to wait for the key US macro releases – the Advance Q4 GDP report and the Personal Consumption Expenditures (PCE) Price Index – before placing fresh directional bets.

Bitcoin, Ethereum and Ripple remain range-bound as breakdown risks rise

Bitcoin, Ethereum, and Ripple are trading sideways within consolidation ranges on Friday, signaling a lack of directional bias in the broader crypto market. BTC rebounded from key support, and ETH is nearing the lower consolidation boundary, while XRP is holding at its lower trendline boundary. 

Hawkish Fed minutes and a market finding its footing

It was green across the board for US Stock market indexes at the close on Wednesday, with most S&P 500 names ending higher, adding 38 points (0.6%) to 6,881 overall. At the GICS sector level, energy led gains, followed by technology and consumer discretionary, while utilities and real estate posted the largest losses.

Official Trump price approaches breakout with mixed signals from traders

Official Trump (TRUMP) is trading at $3.50 at the time of writing, approaching its upper consolidation range. A breakout from this range could open the door for an upside move. On-chain data shows market indecision, with balanced flows between bulls and bears, signaling a lack of clear directional bias.