USD/CHF Price Analysis: Further downside hinges on 0.9970 break
- USD/CHF remains mildly offered inside immediate symmetrical triangle.
- Bearish divergence on RSI teases sellers but clear break of triangle appears necessary.
- Tops marked in June, May add to the upside filters.
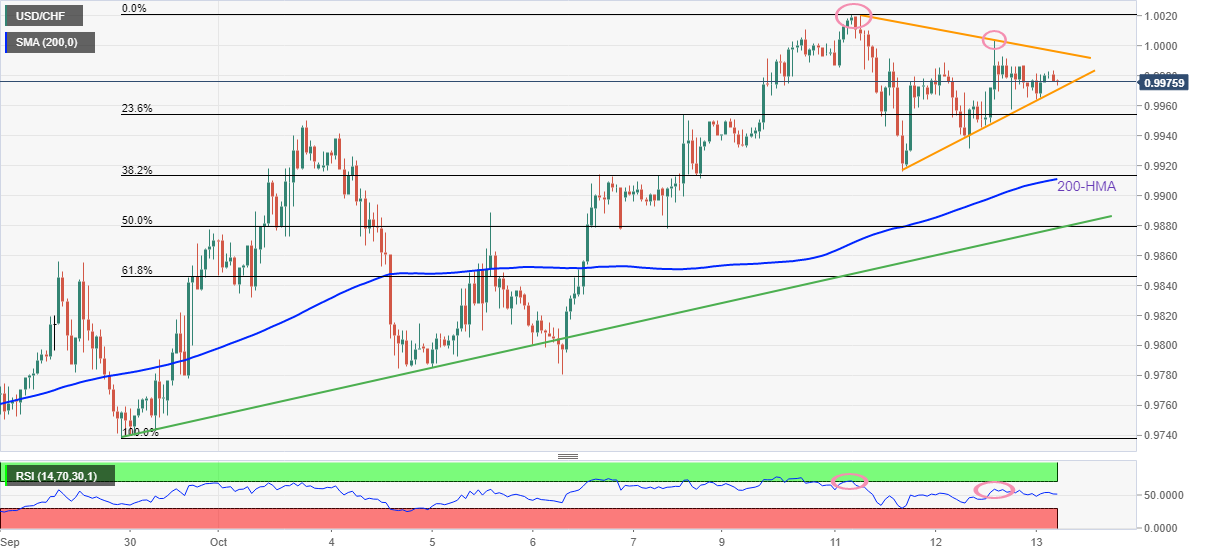
USD/CHF prints mild losses around 0.9975-80 as bears flex muscles inside a three-day-old triangle formation ahead of Thursday’s European session.
That said, the lower high of prices join the lower tops on RSI (14) to portray the hidden bearish divergence, which in turn lures sellers. However, a clear downside break of the stated triangle’s support line, near 0.9970 by the press time, appears necessary for the USD/CHF bears to retake control.
Following that, 200-HMA and an upward-sloping support line from September 30, respectively near 0.9910 and 0.9880, will gain the trader’s attention.
It’s worth noting that the USD/CHF pair’s weakness past 0.9880 won’t hesitate to challenge the monthly low surrounding 0.9785.
Meanwhile, the pair’s successful trading beyond the 1.0000 parity level, also comprising the stated triangle’s resistance line, could propel the quote toward the monthly high near 1.0020.
Even so, tops marked in June and May, around 1.0050 and 1.0065 could challenge the USD/CHF bulls before directing them to the April 2019 peak of around 1.0240.
USD/CHF: Hourly chart
Trend: Further downside expected
Author

Anil Panchal
FXStreet
Anil Panchal has nearly 15 years of experience in tracking financial markets. With a keen interest in macroeconomics, Anil aptly tracks global news/updates and stays well-informed about the global financial moves and their implications.


