|

USD/CHF Price Analysis: Flat with sellers struggling to print eight-year lows beneath 0.8300

  • USD/CHF starts flat, and technical indicators suggest a possible upward correction.
  • Sellers target the USD/CHF below 0.8300; overbought RSI hints at fading selling pressure.
  • Resistance awaits at 0.8700, followed by key Fibonacci levels.

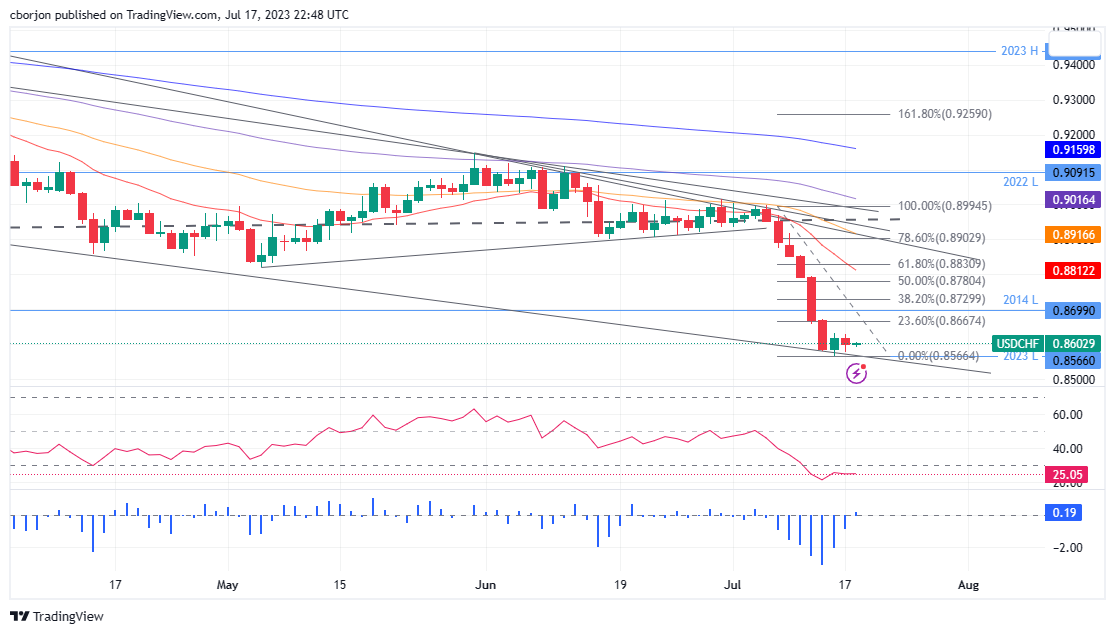
USD/CHF begins the Asian session almost flat, following Monday’s losses of 0.20% after printing a year-to-date (YTD) low of 0.8566 last Friday. Technical indicators turned flat alongside an overextended downtrend, which could pave the way for an upward correction. At the time of writing, the USD/CHF exchanges hands at 0.8605, up 0.03%.

USD/CHF Price Analysis: Technical outlook

From a daily chart perspective, the USD/CHF downtrend remains intact, with sellers eyeing a drop below the YTD low, exposing the pair to a new eight-year low below 0.8300. The Relative Strength Index (RSI) is in bearish territory but turned flat after reaching an overbought extreme level at 21.42, while the three-day Rate of Change (RoC) began to turn neutral, portraying that selling pressure faded, opening the door for a correction.

In that event, the USD/CHF first resistance would be the 0.8700 psychological level, followed by key resistance Fibonacci (Fibo) levels, with 38.2% and 50% Fibo, each at 0.8730 and 0.8780. Once those levels are cleared, the 0.8800 figure would be up next.

On the downside, the USD/CHF first support would be 0.8600, followed by the YTD low of 0.8566 and the 0.8500 psychological level.

USD/CHF Price Action – Daily chart

USD/CHF Daily chart

USD/CHF

Overview
Today last price0.8603
Today Daily Change-0.0016
Today Daily Change %-0.19
Today daily open0.8619
 
Trends
Daily SMA200.8895
Daily SMA500.8965
Daily SMA1000.904
Daily SMA2000.9253
 
Levels
Previous Daily High0.8632
Previous Daily Low0.8566
Previous Weekly High0.8918
Previous Weekly Low0.8566
Previous Monthly High0.912
Previous Monthly Low0.8902
Daily Fibonacci 38.2%0.8607
Daily Fibonacci 61.8%0.8591
Daily Pivot Point S10.858
Daily Pivot Point S20.854
Daily Pivot Point S30.8515
Daily Pivot Point R10.8645
Daily Pivot Point R20.8671
Daily Pivot Point R30.8711

Author

Christian Borjon Valencia

Christian Borjon began his career as a retail trader in 2010, mainly focused on technical analysis and strategies around it. He started as a swing trader, as he used to work in another industry unrelated to the financial markets.

More from Christian Borjon Valencia
Share:

Markets move fast. We move first.

Orange Juice Newsletter brings you expert driven insights - not headlines. Every day on your inbox.

By subscribing you agree to our Terms and conditions.

Editor's Picks

EUR/USD clings to small gains near 1.1750

Following a short-lasting correction in the early European session, EUR/USD regains its traction and clings to moderate gains at around 1.1750 on Monday. Nevertheless, the pair's volatility remains low, with investors awaiting this weeks key data releases from the US and the ECB policy announcements.

GBP/USD edges higher toward 1.3400 ahead of US data and BoE

GBP/USD reverses its direction and advances toward 1.3400 following a drop to the 1.3350 area earlier in the day. The US Dollar struggles to gather recovery momentum as markets await Tuesday's Nonfarm Payrolls data, while the Pound Sterling holds steady ahead of the BoE policy announcements later in the week.

Gold pulls away from session high, holds above $4,300

Gold loses its bullish momentum and retreats below $4,350 after testing this level earlier on Monday. XAU/USD, however, stays in positive territory as the US Dollar remains on the back foot on growing expectations for a dovish Fed policy outlook next year.

Solana consolidates as spot ETF inflows near $1 billion signal institutional dip-buying

Solana price hovers above $131 at the time of writing on Monday, nearing the upper boundary of a falling wedge pattern, awaiting a decisive breakout. On the institutional side, demand for spot Solana Exchange-Traded Funds remained firm, pushing total assets under management to nearly $1 billion since launch. 

Big week ends with big doubts

The S&P 500 continued to push higher yesterday as the US 2-year yield wavered around the 3.50% mark following a Federal Reserve (Fed) rate cut earlier this week that was ultimately perceived as not that hawkish after all. The cut is especially boosting the non-tech pockets of the market.

Solana Price Forecast: SOL consolidates as spot ETF inflows near $1 billion signal institutional dip-buying

Solana (SOL) price hovers above $131 at the time of writing on Monday, nearing the upper boundary of a falling wedge pattern, awaiting a decisive breakout.