|

USD/CHF Price Analysis: Fades bounce off 27-month low within bullish triangle

  • USD/CHF takes offers to refresh intraday low, retreats from top line of a two-week-old descending triangle.
  • Sluggish oscillators suggest continuation of lower grind, multiple levels surrounding 0.8860 challenge Swiss Franc pair sellers.
  • Bulls need validation from 200-HMA to retake control.

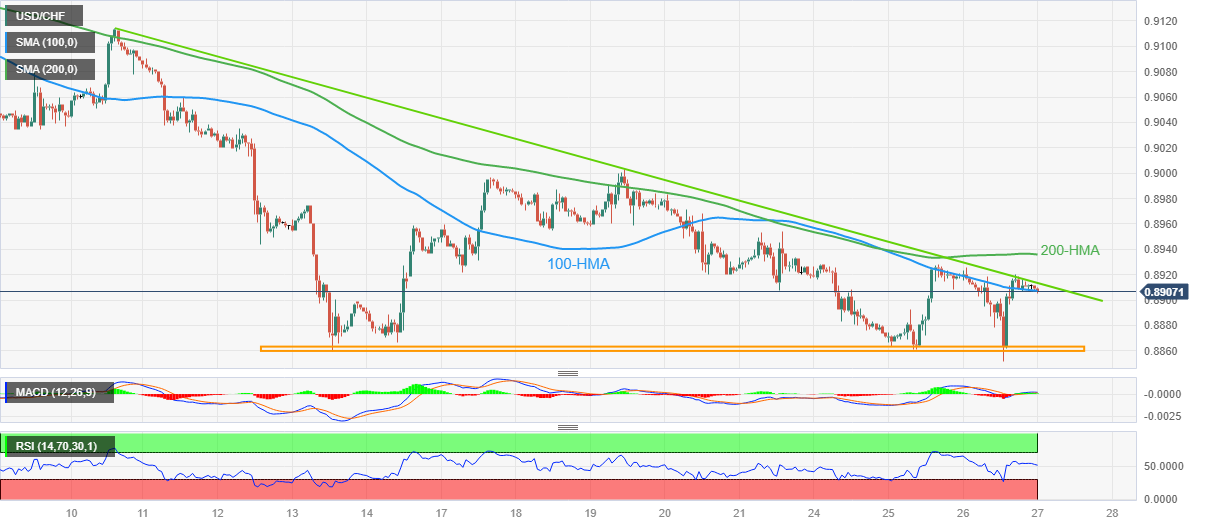
USD/CHF refreshes intraday low near 0.8705 as it drops back towards the lowest levels since January 2021 marked the previous day amid Thursday’s sluggish Asian session. In doing so, the Swiss Franc (CHF) pair retreats from the resistance line of a two-week-old bullish triangle, recently slipping beneath the 100-Hour Moving Average (HMA).

Given the unimpressive prints of the MACD signals and RSI (14), the USD/CHF is likely to continue declining.

However, multiple supports around 0.8860 appear a tough nut to crack for the Swiss Franc pair sellers to break.

Following that, the pair’s gradual south run towards the year 2021 low of around 0.8755 can’t be ruled out.

Meanwhile, the 100-HMA and the top line of the aforementioned triangle, respectively near 0.8910 and 0.8915, guard the short-term recovery of the USD/CHF pair.

It’s worth noting that the confirmation of the bullish triangle breakout, via a sustained break of 0.8915, isn’t an open invitation to the USD/CHF buyers as they need validation from the 200-HMA hurdle of 0.8935.

Also acting as an upside filter is the previous weekly high around the 0.9000 psychological magnet, a break of which could propel the quote towards the monthly top surrounding 0.9200.

USD/CHF: Hourly chart

Trend: Limited downside expected

Additional important levels

Overview
Today last price0.8907
Today Daily Change-0.0004
Today Daily Change %-0.04%
Today daily open0.8911
 
Trends
Daily SMA200.9001
Daily SMA500.917
Daily SMA1000.9212
Daily SMA2000.9455
 
Levels
Previous Daily High0.8926
Previous Daily Low0.8852
Previous Weekly High0.9003
Previous Weekly Low0.8908
Previous Monthly High0.944
Previous Monthly Low0.9072
Daily Fibonacci 38.2%0.888
Daily Fibonacci 61.8%0.8898
Daily Pivot Point S10.8867
Daily Pivot Point S20.8822
Daily Pivot Point S30.8793
Daily Pivot Point R10.894
Daily Pivot Point R20.897
Daily Pivot Point R30.9014

Author

Anil Panchal

Anil Panchal

FXStreet

Anil Panchal has nearly 15 years of experience in tracking financial markets. With a keen interest in macroeconomics, Anil aptly tracks global news/updates and stays well-informed about the global financial moves and their implications.

More from Anil Panchal
Share:

Markets move fast. We move first.

Orange Juice Newsletter brings you expert driven insights - not headlines. Every day on your inbox.

By subscribing you agree to our Terms and conditions.

Editor's Picks

EUR/USD stays defensive below 1.1750 as USD finds its feet

EUR/USD kicks off the new week on a softer note, holding below 1.1750 in European trading on Monday. The pair faces challenges due to a pause in the US Dollar downtrend, with traders shifting their focus to the delayed US Nonfarm Payrolls and CPI data for fresh directives. The ECB policy decision is also eagerly awaited. 

GBP/USD holds steady above 1.3350 as traders await key data and BoE

GBP/USD remains on the back foot above 1.3350 in the European session on Monday, though it lacks bearish conviction and holds above the key 200-day SMA support. The US Dollar holds its recovery mode ahead of key data releases, while the Pound Sterling faces headwinds from the expected BoE rate cut this week. 

Gold climbs to seven-week highs on Fed rate cut bets, safe-haven demand

Gold price rises to seven-week highs to near $4,350 during the early European trading hours on Monday. The precious metal extends its upside amid the prospect of interest rate cuts by the US Fed next year. Lower interest rates could reduce the opportunity cost of holding Gold, supporting the non-yielding precious metal.

Solana consolidates as spot ETF inflows near $1 billion signal institutional dip-buying

Solana price hovers above $131 at the time of writing on Monday, nearing the upper boundary of a falling wedge pattern, awaiting a decisive breakout. On the institutional side, demand for spot Solana Exchange-Traded Funds remained firm, pushing total assets under management to nearly $1 billion since launch. 

Big week ends with big doubts

The S&P 500 continued to push higher yesterday as the US 2-year yield wavered around the 3.50% mark following a Federal Reserve (Fed) rate cut earlier this week that was ultimately perceived as not that hawkish after all. The cut is especially boosting the non-tech pockets of the market.

Solana Price Forecast: SOL consolidates as spot ETF inflows near $1 billion signal institutional dip-buying

Solana (SOL) price hovers above $131 at the time of writing on Monday, nearing the upper boundary of a falling wedge pattern, awaiting a decisive breakout.