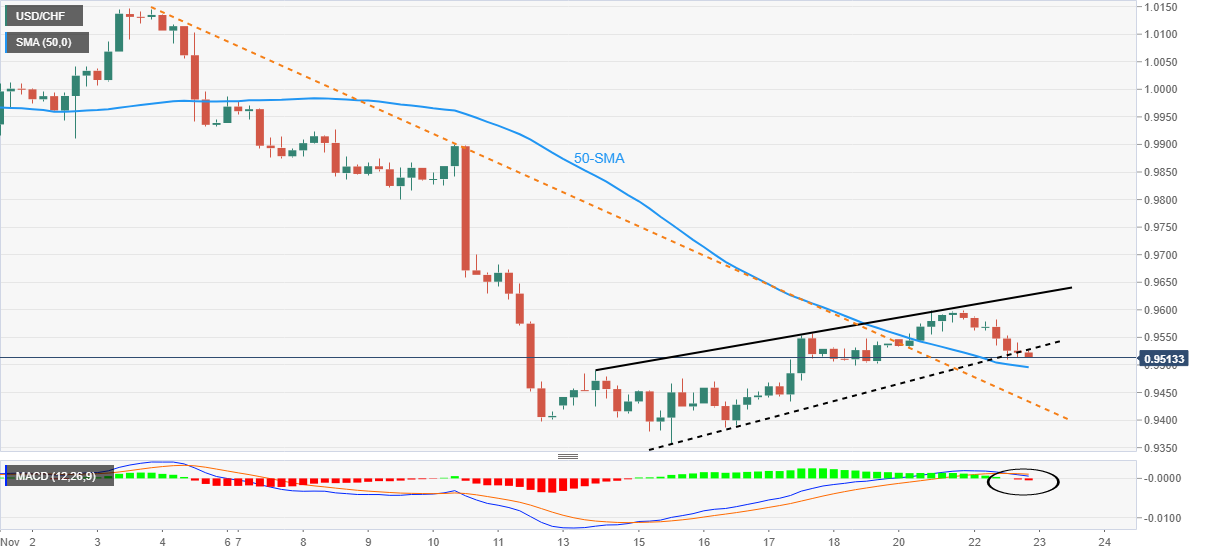
- USD/CHF stays depressed after snapping six-day uptrend the previous day.
- Clear break of one-week-old bearish channel, downbeat MACD signals favor sellers.
- 50-SMA, previous resistance line from November 03 challenge immediate downside.
USD/CHF holds lower ground near 0.9515 following the first daily negative in seven.
The Swiss Franc (CHF) pair broke a one-week-old bullish channel the previous day and welcomed the bears. While adding strength to the downside bias are the recently bearish signals from the Moving Average Convergence and Divergence (MACD) indicator.
However, the 50-SMA level surrounding 0.9495 precedes the resistance-turned-support line from November 03, close to 0.9430 by the press time, to challenge the USD/CHF pair’s immediate declines.
Following that, the 0.9400 round figure and the monthly low surrounding 0.9355 should gain the market’s attention.
On the flip side, the aforementioned channel’s support line acts as an immediate resistance around 0.9530, a break of which could escalate the corrective bounce towards the channel’s top, near 0.9630.
Should the USD/CHF bulls manage to keep the reins, the November 11 swing high surrounding the 0.9900 threshold will be important to watch for the pair’s further upside momentum. If the pair remains firmer past 0.9900, the odds of its run-up towards the monthly high near 1.0150 can’t be ruled out.
Overall, USD/CHF is likely to refresh the monthly low unless rising back beyond the 0.9900 mark.
USD/CHF: Four-hour chart
Trend: Further downside expected
Information on these pages contains forward-looking statements that involve risks and uncertainties. Markets and instruments profiled on this page are for informational purposes only and should not in any way come across as a recommendation to buy or sell in these assets. You should do your own thorough research before making any investment decisions. FXStreet does not in any way guarantee that this information is free from mistakes, errors, or material misstatements. It also does not guarantee that this information is of a timely nature. Investing in Open Markets involves a great deal of risk, including the loss of all or a portion of your investment, as well as emotional distress. All risks, losses and costs associated with investing, including total loss of principal, are your responsibility. The views and opinions expressed in this article are those of the authors and do not necessarily reflect the official policy or position of FXStreet nor its advertisers. The author will not be held responsible for information that is found at the end of links posted on this page.
If not otherwise explicitly mentioned in the body of the article, at the time of writing, the author has no position in any stock mentioned in this article and no business relationship with any company mentioned. The author has not received compensation for writing this article, other than from FXStreet.
FXStreet and the author do not provide personalized recommendations. The author makes no representations as to the accuracy, completeness, or suitability of this information. FXStreet and the author will not be liable for any errors, omissions or any losses, injuries or damages arising from this information and its display or use. Errors and omissions excepted.
The author and FXStreet are not registered investment advisors and nothing in this article is intended to be investment advice.
Recommended content
Editors’ Picks

EUR/USD stays strongly bid above 1.0400 ahead of EU data
EUR/USD trades with moderate gains abpve 1.0400 in the European session on Thursday. The pair draws support from risk-on sentiment-led unabated US Dollar selling as traders anticipate a likely end to the Russia-Ukraine war. EU and US data remain in focus.

GBP/USD holds gains near 1.2500 after UK GDP data
GBP/USD sustains bullish momentum and trades near 1.2500 in the European session on Thursday. Pound Sterling benefits from the improving risk mood and the upbeat UK data, which showed that the economy expanded at an annual rate of 1.4% in Q4, surpassing the market expectation of 1.1%.

Gold picks up ascent despite risks residing in the background
Gold’s price soars again and resumes its rally near $2,920 at the time of writing on Thursday, with Bullion traders shrugging off the United States (US) Consumer Price Index (CPI) data for January released on Wednesday.

Ripple's XRP eyes a recovery as investors switch toward accumulation
Ripple's XRP is up 2% in the early Asian session on Thursday following rising accumulation among investors and a potential bottom signal in the MVRV Ratio.

How the European Union could counter US tariffs
With Trump ordering a 25% import tax on all steel and aluminium entering the US, trade tensions are inching closer to Europe. We take a closer look at how European policymakers could react. Spoiler alert: it's complicated.

The Best Brokers of the Year
SPONSORED Explore top-quality choices worldwide and locally. Compare key features like spreads, leverage, and platforms. Find the right broker for your needs, whether trading CFDs, Forex pairs like EUR/USD, or commodities like Gold.