- USD/CHF prints the first daily gains in three within one-week-old rising wedge bearish chart pattern.
- 50-SMA adds strength to 0.8720–15 support amid bearish MACD signals.
- 200-SMA guards immediate upside ahead of nine-week-old descending resistance line.
- Multiple troughs marked since mid-July together constitute short-term key support near 0.8565-55.
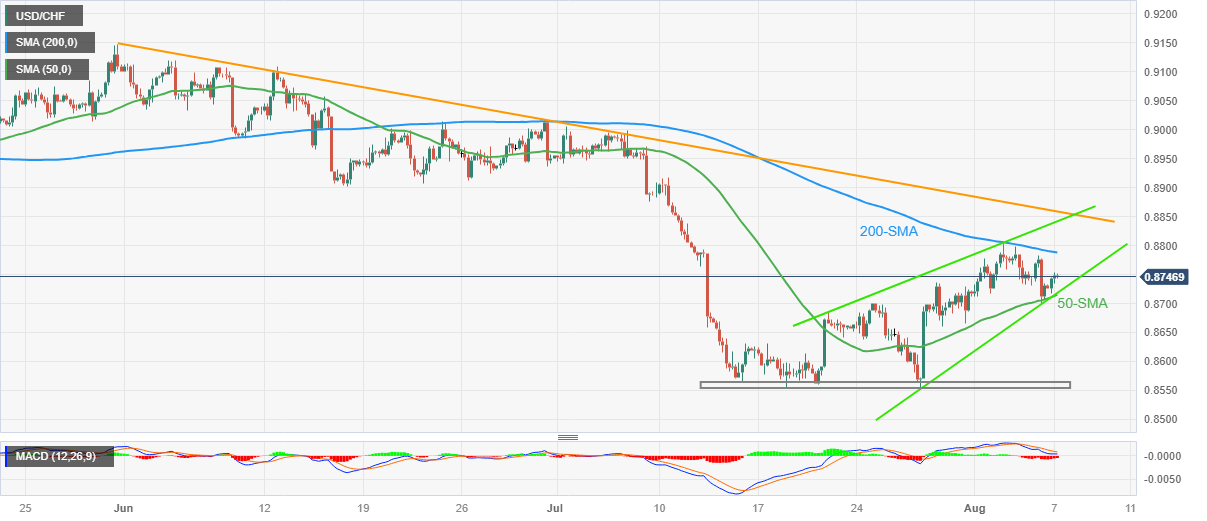
USD/CHF grinds near the intraday high surrounding 0.8755 as it prints the first daily gain in three heading into Monday’s European session. In doing so, the Swiss Franc (CHF) pair extends the previous day’s rebound from the 50-SMA.
Despite the pair’s latest rebound from the 50-SMA, it portrays a fortnight-old rising wedge bearish chart formation, currently between 0.8715 and 0.8840.
However, the bearish MACD signals and the 200-SMA hurdle of 0.8790 restrict the immediate recovery of the USD/CHF pair.
Even if the USD/CHF bulls manage to cross the 0.8840 hurdle and defy the rising wedge bearish chart pattern, a downward-sloping resistance line from May 31, close to 0.8860 at the latest, will act as the last defense of the sellers.
Meanwhile, a clear downside break of the 0.8720–15 support confluence, encompassing the stated wedge’s lower line and the 50-SMA, will recall the USD/CHF bears.
Following that, a slew of lows marked since July 14, close to 0.8565–55, will be in the spotlight as a break which will direct the Swiss Franc pair towards the theoretical target of the rising wedge confirmation, close to 0.8470.
USD/CHF: Four-hour chart
Trend: Pullback expected
Information on these pages contains forward-looking statements that involve risks and uncertainties. Markets and instruments profiled on this page are for informational purposes only and should not in any way come across as a recommendation to buy or sell in these assets. You should do your own thorough research before making any investment decisions. FXStreet does not in any way guarantee that this information is free from mistakes, errors, or material misstatements. It also does not guarantee that this information is of a timely nature. Investing in Open Markets involves a great deal of risk, including the loss of all or a portion of your investment, as well as emotional distress. All risks, losses and costs associated with investing, including total loss of principal, are your responsibility. The views and opinions expressed in this article are those of the authors and do not necessarily reflect the official policy or position of FXStreet nor its advertisers. The author will not be held responsible for information that is found at the end of links posted on this page.
If not otherwise explicitly mentioned in the body of the article, at the time of writing, the author has no position in any stock mentioned in this article and no business relationship with any company mentioned. The author has not received compensation for writing this article, other than from FXStreet.
FXStreet and the author do not provide personalized recommendations. The author makes no representations as to the accuracy, completeness, or suitability of this information. FXStreet and the author will not be liable for any errors, omissions or any losses, injuries or damages arising from this information and its display or use. Errors and omissions excepted.
The author and FXStreet are not registered investment advisors and nothing in this article is intended to be investment advice.
Recommended content
Editors’ Picks
![GBP/USD rises above 1.2450 ahead of UK GDP data](https://editorial.fxsstatic.com/images/i/GBP-bullish-object_Medium.png)
GBP/USD rises above 1.2450 ahead of UK GDP data
GBP/USD extends its winning streak for the third consecutive day, trading around 1.2460 during Thursday’s Asian session. Traders await the UK’s preliminary Gross Domestic Product (GDP) data due later in the day.
![EUR/USD appreciates to near 1.0450 ahead of German HICP inflation data](https://editorial.fxsstatic.com/images/i/EURUSD_Medium.png)
EUR/USD appreciates to near 1.0450 ahead of German HICP inflation data
The EUR/USD pair continues its upward momentum for the third straight session, hovering around 1.0430 during Asian trading hours on Thursday.
![Gold price builds on steady intraday ascent amid trade war fears and weaker USD](https://editorial.fxsstatic.com/images/i/Commodities_Gold-2_Medium.jpg)
Gold price builds on steady intraday ascent amid trade war fears and weaker USD
Gold price attracts buyers for the second straight day amid a combination of supportive factors. Concerns about Trump’s trade tariff and a modest USD weakness underpin the XAU/USD pair.
![Ripple's XRP eyes a recovery as investors switch toward accumulation](https://editorial.fxsstatic.com/images/i/XRP-bullish-realistic_Medium.png)
Ripple's XRP eyes a recovery as investors switch toward accumulation
Ripple's XRP is up 2% in the early Asian session on Thursday following rising accumulation among investors and a potential bottom signal in the MVRV Ratio.
![How the European Union could counter US tariffs](https://editorial.fxsstatic.com/images/i/Global-Concept_3_Medium.png)
How the European Union could counter US tariffs
With Trump ordering a 25% import tax on all steel and aluminium entering the US, trade tensions are inching closer to Europe. We take a closer look at how European policymakers could react. Spoiler alert: it's complicated.
![The Best Brokers of the Year](https://editorial.fxsstatic.com/images/Brokers/Editors_Pick_Box_395x179_Medium.png)
The Best Brokers of the Year
SPONSORED Explore top-quality choices worldwide and locally. Compare key features like spreads, leverage, and platforms. Find the right broker for your needs, whether trading CFDs, Forex pairs like EUR/USD, or commodities like Gold.