|

USD/CHF Price Analysis: Bears moved in around 0.8780s, dragging prices lower

  • USD/CHF retreats to 0.8838, down 0.06%, as US Treasury yields dip following Powell’s hawkish remarks, putting sellers in the driver’s seat.
  • A ‘gravestone-doji’ formation on the charts suggests further downside risk, challenging the pair’s recent six-week high of 0.8876.
  • For a bullish reversal, USD/CHF must reclaim the 0.8900 level, with key resistance and support levels looming at 0.9000 and 0.8819, respectively.

USD/CHF retraces from a six-week high of 0.8876, drops as sellers outpaced buyers, as US Treasury bond yields dropped after the US Federal Reserve Chair Jerome Powell speech. At the time of writing, the USD/CHF is trading at 0.8838, down 0.06%.

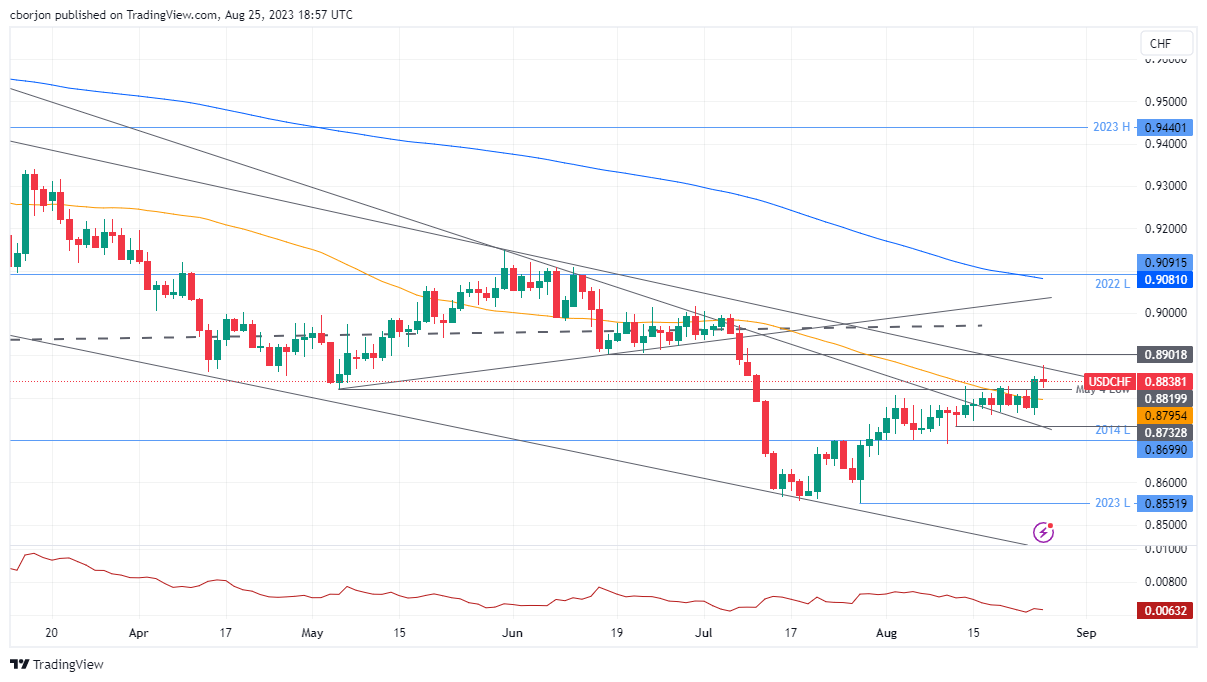
USD/CHF Price Analysis: Technical outlook

From a technical standpoint, the USD/CHF clashed with a five-month-old downslope resistance trendline, reaching a new six-week high, but has retraced, trimming its earlier gains and turning negative, so far in the day, about to form a ‘gravestone-doji’ which would suggest further downside expected.

For buyers to resume their uptrend, the pair must reclaim 0.8900. A breach of the latter will expose the fourth-month-old previous support turned resistance trendline above the 0.9000 figure, followed by the 200-day Moving Average (DMA) at 0.9082. Conversely, the USD/CHF first support emerges at a May 4 daily low of 0.8819. Break below will send the pair towards 0.8800, followed by the current week’s low of 0.8759.

USD/CHF Price Action – Hourly chart

USD/CHF Daily chart

USD/CHF

Overview
Today last price0.884
Today Daily Change-0.0004
Today Daily Change %-0.05
Today daily open0.8844
 
Trends
Daily SMA200.877
Daily SMA500.8799
Daily SMA1000.8892
Daily SMA2000.9087
 
Levels
Previous Daily High0.8852
Previous Daily Low0.876
Previous Weekly High0.8828
Previous Weekly Low0.8738
Previous Monthly High0.9005
Previous Monthly Low0.8552
Daily Fibonacci 38.2%0.8817
Daily Fibonacci 61.8%0.8795
Daily Pivot Point S10.8786
Daily Pivot Point S20.8727
Daily Pivot Point S30.8694
Daily Pivot Point R10.8877
Daily Pivot Point R20.891
Daily Pivot Point R30.8969

Author

Christian Borjon Valencia

Markets analyst, news editor, and trading instructor with over 14 years of experience across FX, commodities, US equity indices, and global macro markets.

More from Christian Borjon Valencia
Share:

Editor's Picks

EUR/USD holds above 1.1750 after mixed EU PMI data

EUR/USD manages to hold above 1.1750 but struggles to gather recovery momentum on Friday, following the mixed February PMI figures from Germany and the Eurozone. In the second half of the day, Q4 GDP, December inflation and February PMI data from the US will be watched closely by market participants.

GBP/USD recovers further toward 1.3500 after UK PMI data

GBP/USD is recovering ground further toward 1.3500 in European trading on Friday, helped by a modest uptick in the Pound Sterling after stronger-than-expected UK January Retail Sales and February PMI data. However, the pair's further upside could be limited amid persistent US Dollar strength as the focus turns to key US data. 

Gold sticks to positive bias above $5,000 ahead of US data

Gold gains some positive traction for the third consecutive day on Friday. holding above $5,000. Traders now look forward to the key US macro releases – the Advance Q4 GDP report and the Personal Consumption Expenditures (PCE) Price Index – for fresh trading impetus. 

US GDP growth expected to slow down significantly in Q4 after stellar Q3 

The United States Bureau of Economic Analysis will publish the first preliminary estimate of the fourth-quarter Gross Domestic Product at 13:30 GMT. Analysts forecast the US economy to have expanded at a 3% annualized rate, slowing down from the 4.4% growth posted in the previous quarter.

Iran tensions and AI fears at the forefront ahead of key US data

Thursday’s scorecard shows major US Stock benchmarks closed modestly in the red amid mounting US-Iran tensions and AI disruption worries. The S&P 500 shed 19 points (0.3%) to 6,861, the Nasdaq 100 lost 101 points (0.4%) to 24,797, and the Dow Jones Industrial Average dropped 267 points (0.5%) to 49,395.

Official Trump price approaches breakout with mixed signals from traders

Official Trump (TRUMP) is trading at $3.50 at the time of writing, approaching its upper consolidation range. A breakout from this range could open the door for an upside move. On-chain data shows market indecision, with balanced flows between bulls and bears, signaling a lack of clear directional bias.