|

USD/CHF Price Analysis: 50-HMA probes bulls inside falling wedge

  • USD/CHF buyers struggle inside a bullish chart formation.
  • Upbeat MACD signals suggest further advances, 200-HMA acts as an additional upside filter.
  • Bears have a bumpy road to travel unless breaking 0.9300 support.

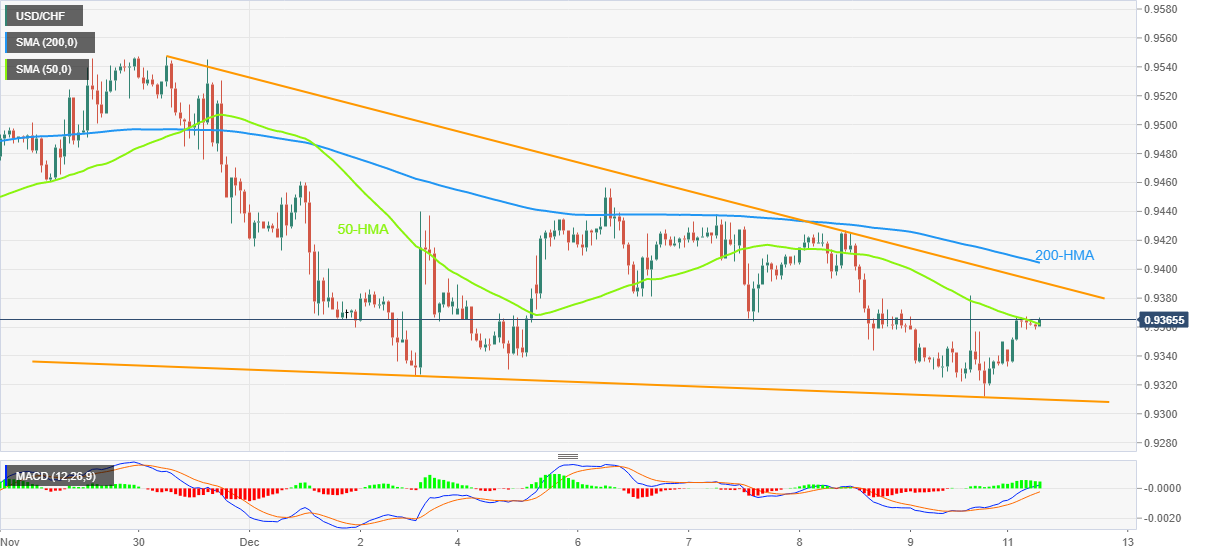
USD/CHF prints mild gains around 0.9360 even as the 50-Hour Moving Average (HMA) challenges the buyers during early Monday in Europe. In doing so, the Swiss Franc (CHF) pair justifies bullish MACD signals while staying inside a short-term falling wedge bullish chart pattern.

That said, the quote’s latest weakness becomes less troublesome beyond the stated wedge’s support line, around 0.9310 at the latest.

Even if the quote defies the bullish chart formation, by breaking the 0.9310 support, the 0.9300 round figure could act as an extra filter to the south before pleasing the USD/CHF bears.

In that case, lows marked during April and March around 0.9195 and 0.9150 respectively, will gain the major attention of the pair sellers.

Meanwhile, recovery moves need validation from the 50-HMA hurdle of 0.9365, a break of which could poke the stated wedge’s upper line, close to 0.9395 at the latest.

It should be noted that the USD/CHF run-up beyond 0.9395 should provide a clear break of the 200-HMA, around 0.9405 by the press time, to boost the buyer’s morale.

Following that, a rally towards the late November swing high around the 0.9600 threshold can’t be ruled out.

USD/CHF: Hourly chart

Trend: Further upside expected

Additional important levels

Overview
Today last price0.936
Today Daily Change0.0010
Today Daily Change %0.11%
Today daily open0.935
 
Trends
Daily SMA200.945
Daily SMA500.9737
Daily SMA1000.9692
Daily SMA2000.9647
 
Levels
Previous Daily High0.9382
Previous Daily Low0.9312
Previous Weekly High0.9456
Previous Weekly Low0.9312
Previous Monthly High1.0148
Previous Monthly Low0.9357
Daily Fibonacci 38.2%0.9339
Daily Fibonacci 61.8%0.9355
Daily Pivot Point S10.9314
Daily Pivot Point S20.9278
Daily Pivot Point S30.9244
Daily Pivot Point R10.9384
Daily Pivot Point R20.9418
Daily Pivot Point R30.9454

Author

Anil Panchal

Anil Panchal

FXStreet

Anil Panchal has nearly 15 years of experience in tracking financial markets. With a keen interest in macroeconomics, Anil aptly tracks global news/updates and stays well-informed about the global financial moves and their implications.

More from Anil Panchal
Share:

Editor's Picks

EUR/USD holds losses below 1.1850 near nine-day EMA barrier

EUR/USD extends its losses for the second successive session, trading around 1.1840 during the early European hours on Tuesday. The 14-day Relative Strength Index momentum indicator at 53 (neutral) signals consolidation with a modest upside lean.

When is the UK employment data and how could it affect GBP/USD?

The United Kingdom labor market data for the three months ending December is scheduled to be published today at 07:00 GMT.  GBP/USD trades 0.16% lower to near 1.3610 at the press time. The 20-period Exponential Moving Average slips to 1.3631 and caps rebounds as price holds below the gauge.

Gold adds to intraday losses as risk-on mood offsets dovish Fed and subdued USD demand

Gold attracts some follow-through selling for the second straight day and dives to over a one-week low, around the $4,858 area, heading into the European session on Tuesday. The commodity, however, quickly recovers to the $4,900 mark as traders opt to await more cues about the US Federal Reserve's (Fed) rate-cut path before placing fresh directional bets.

Pi Network rallies ahead of its first anniversary

Pi Network trades above $0.1800 at the time of writing on Tuesday, recording nearly 5% gains so far. On-chain data indicate that large wallet investors, commonly known as whales, have accumulated approximately 4 million PI tokens over the last 24 hours.

The week ahead: Key inflation readings and why the AI trade could be overdone

It is likely to be a quiet start to the week, with US markets closed on Monday for Presidents Day. European markets are higher across the board and gold is clinging to the $5,000 level after the tamer than expected CPI report in the US reduced haven flows to precious metals.

Stellar mixed sentiment caps recovery

Stellar price remains under pressure, trading at $0.170 on Tuesday after failing to close above the key resistance on Sunday. The derivatives metric supports the bearish sentiment, with XLM’s short bets rising among traders and funding rates turning negative.