|

USD/CAD technical analysis: Greenback slips below last week low approaching the 1.3100 handle

  • USD/CAD is under pressure approaching the 1.3100 figure.
  • Bears need a breakout below last week low at 1.3150 support. 
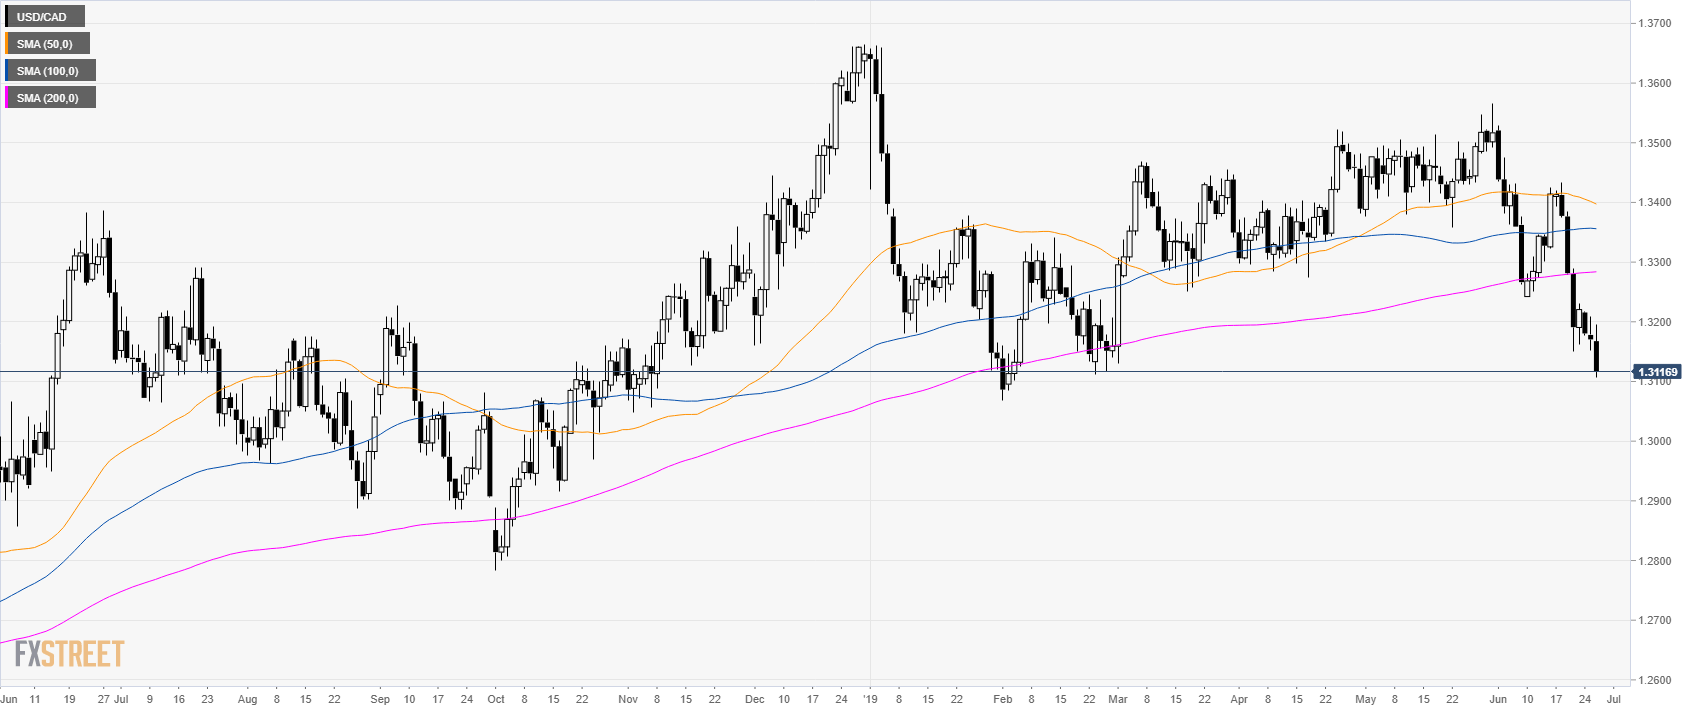
USD/CAD daily chart

USD/CAD is breaking below last week low while below the main daily simple moving averages (DSMAs). 


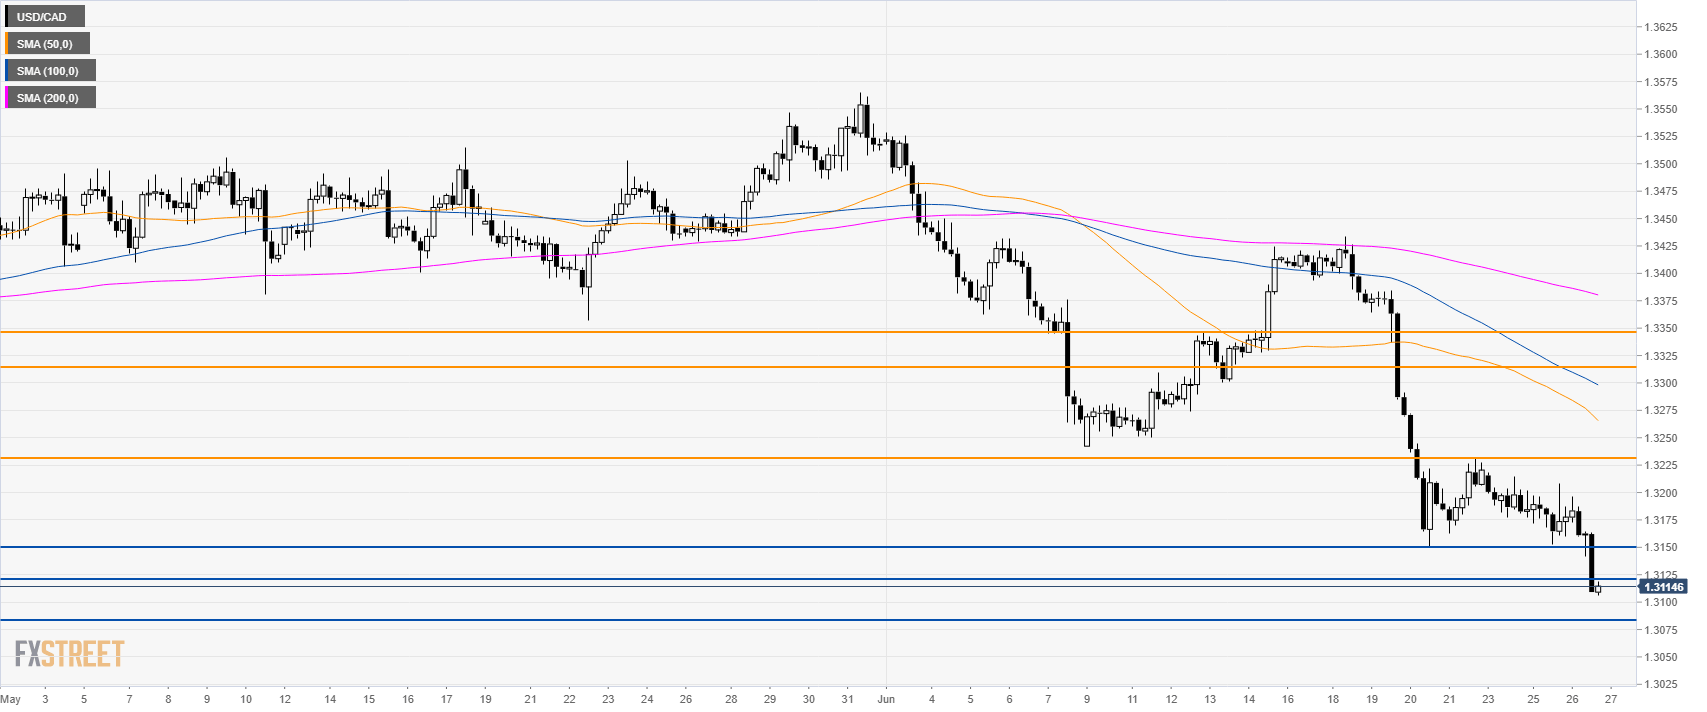
USD/CAD 4-hour chart

USD/CAD is under pressure below the main SMAs. Sellers want to reach 1.3084 swing low.


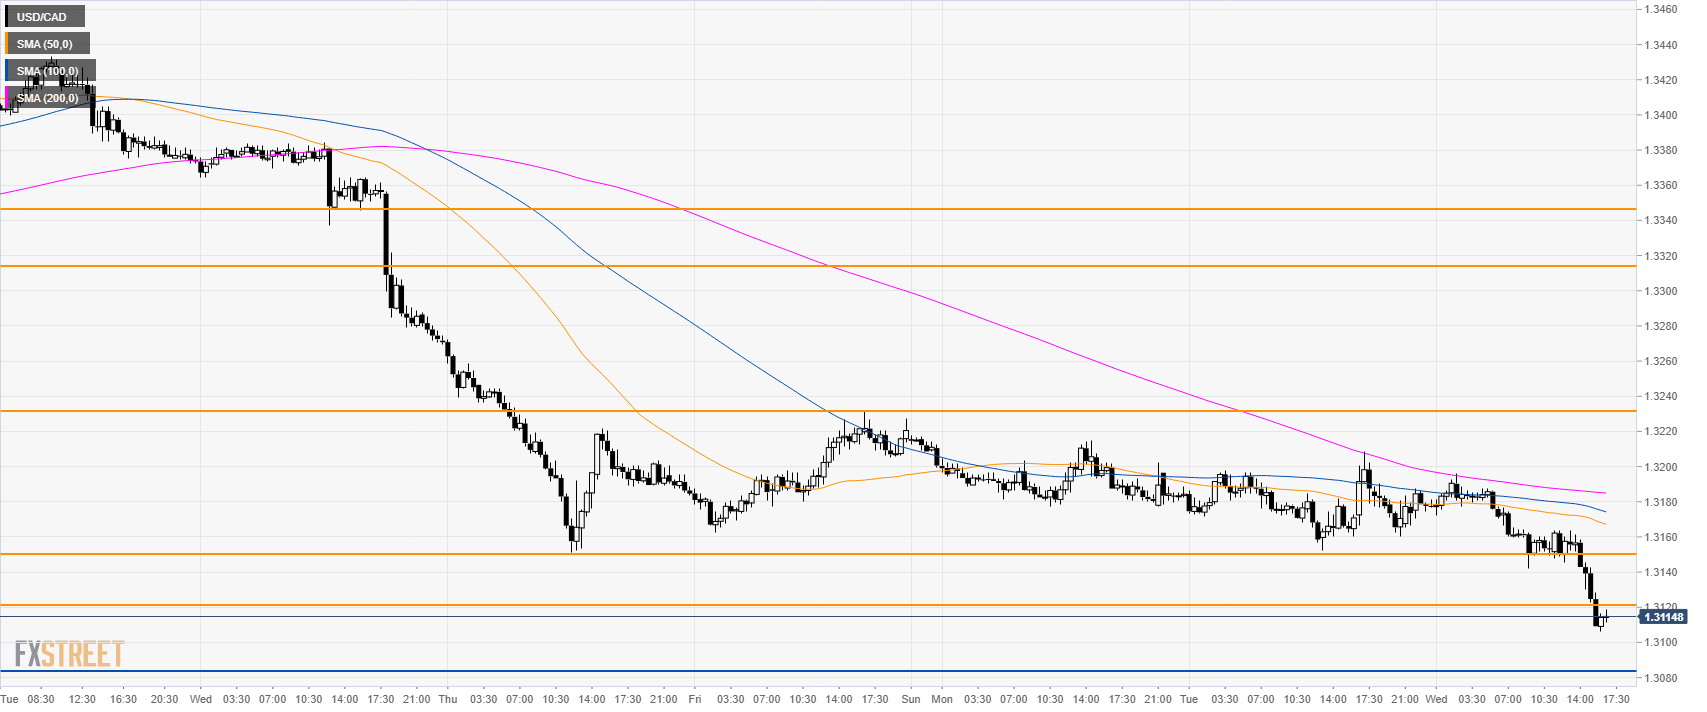
USD/CAD 30-minute chart

The market is trading below its main SMAs suggesting a negative bias. Resistances are seen at 1.3120 and 1.3150, according to the Technical Confluences Indicator.

Additional key levels

USD/CAD

Overview
Today last price1.3115
Today Daily Change-0.0055
Today Daily Change %-0.42
Today daily open1.317
 
Trends
Daily SMA201.3344
Daily SMA501.3402
Daily SMA1001.3357
Daily SMA2001.3289
Levels
Previous Daily High1.3209
Previous Daily Low1.3152
Previous Weekly High1.3434
Previous Weekly Low1.3151
Previous Monthly High1.3566
Previous Monthly Low1.3357
Daily Fibonacci 38.2%1.3174
Daily Fibonacci 61.8%1.3187
Daily Pivot Point S11.3146
Daily Pivot Point S21.3121
Daily Pivot Point S31.309
Daily Pivot Point R11.3202
Daily Pivot Point R21.3233
Daily Pivot Point R31.3258

Author

Flavio Tosti

Flavio Tosti

Independent Analyst


More from Flavio Tosti
Share:

Editor's Picks

EUR/USD flat lines around 1.1900; looks to US NFP report for fresh directional impetus

The EUR/USD pair is seen oscillating in a narrow trading band around the 1.1900 mark during the Asian session on Wednesday as traders opt to wait for the release of US monthly employment details before placing fresh directional bets.

GBP/USD slips back to daily lows near 1.3640

GBP/USD drops to daily lows near 1.3640 as sellers push harder and the Greenback extends its rebound in the latter part of Tuesday’s session. Looking ahead, the combination of key US releases, including NFP and CPI, alongside important UK data, should keep the pound firmly in focus over the coming days.

Gold awaits US Nonfarm Payrolls data for a sustained upside

Gold remains capped below $5,100 early Wednesday, gathering pace for the US labor data. The US Dollar licks its wounds amid persistent Japanese Yen strength and potential downside risks to the US jobs report. Gold holds above $5,000 amid bullish daily RSI, with eyes on 61.8% Fibo resistance at $5,141.

Bitcoin, Ethereum and Ripple show no sign of recovery

Bitcoin, Ethereum, and Ripple show signs of cautious stabilization on Wednesday after failing to close above their key resistance levels earlier this week. BTC trades below $69,000, while ETH and XRP also encountered rejection near major resistance levels. With no immediate bullish catalyst, the top three cryptocurrencies continue to show no clear signs of a sustained recovery.

Dollar drops and stocks rally: The week of reckoning for US economic data

Following a sizeable move lower in US technology Stocks last week, we have witnessed a meaningful recovery unfold. The USD Index is in a concerning position; the monthly price continues to hold the south channel support.

XRP holds $1.40 amid ETF inflows and stable derivatives market

Ripple trades under pressure, with immediate support at $1.40 holding at the time of writing on Tuesday. A recovery attempt from last week’s sell-off to $1.12 stalled at $1.54 on Friday, leading to limited price action between the current support and the resistance.