• USD/CAD surrendered 1.3400, as buyers could not break the confluence of the 20 and 100-day EMAs.
  • USD/CAD Price Analysis: Upward biased, but once it falls below 1.3225, a move towards 1.3000 is on the cards

The USD/CAD extended its losses on Thursday after hitting a daily high of 1.3407, though as the Asian session begins, it’s almost unchanged. Additionally, the 20-day Exponential Moving Average (EMA) is crossing below the 100-day EMA, a bearish signal, suggesting further downside pressure lies ahead. At the time of writing, the USD/CAD is trading at 1.3323.

USD/CAD Price Analysis: Technical outlook

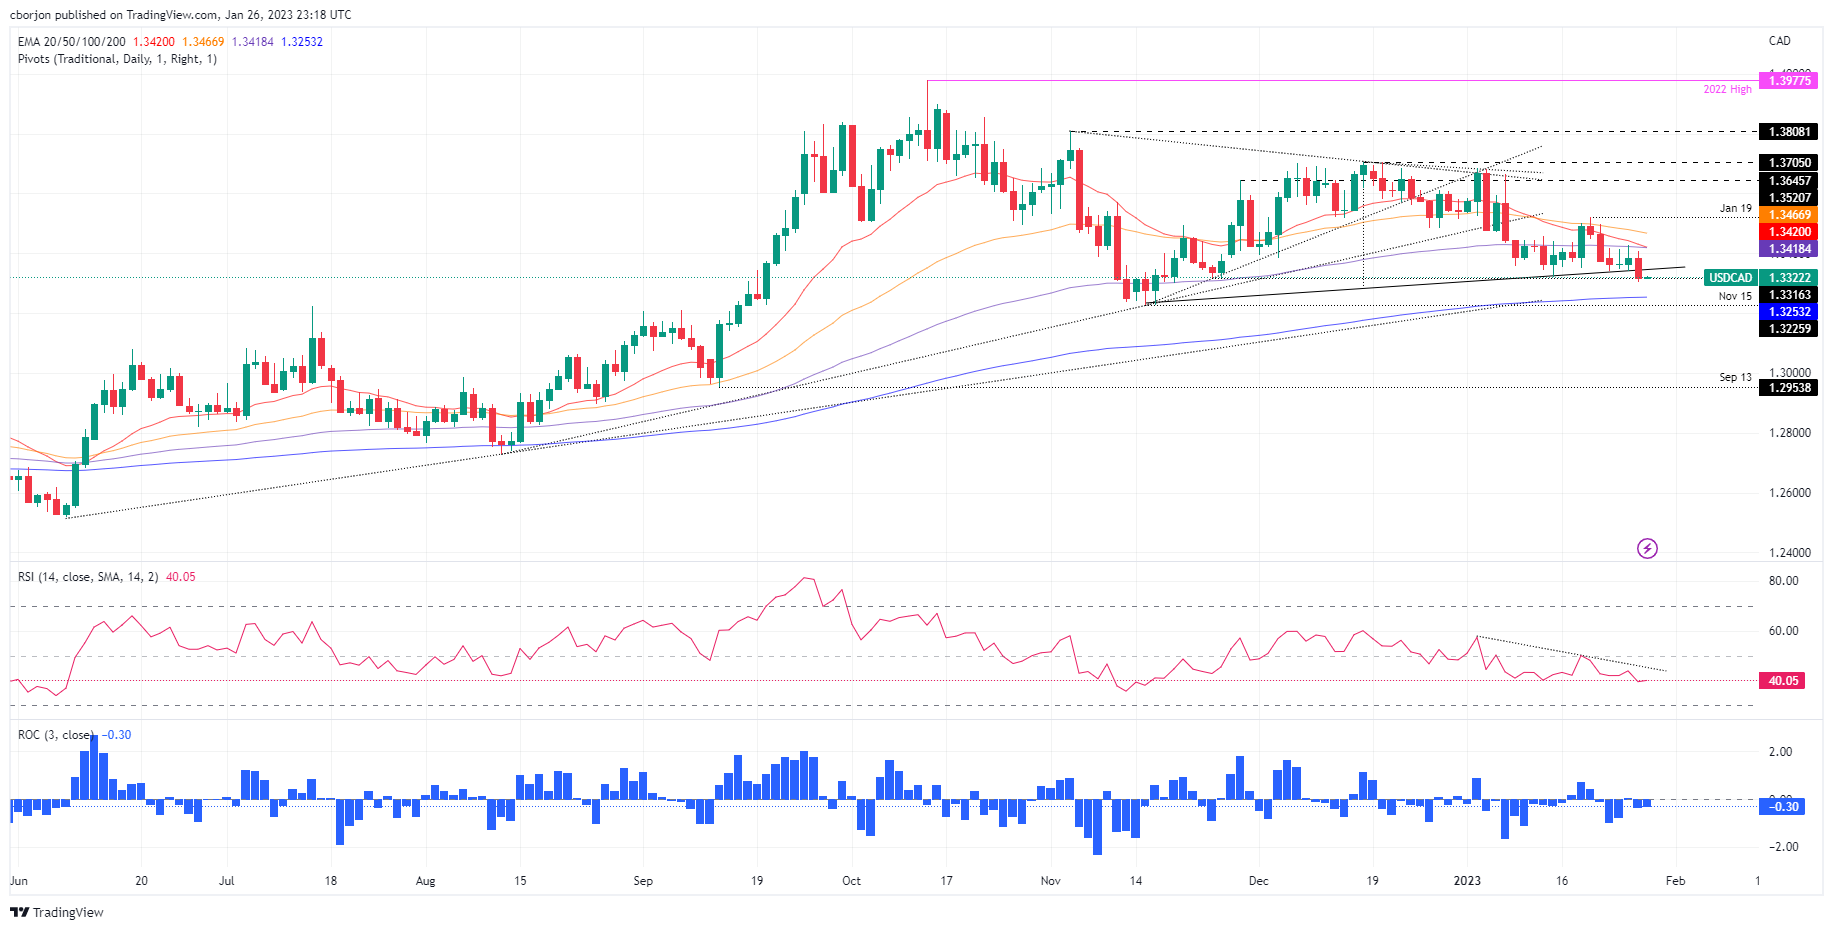
From a daily chart perspective, the Loonie (CAD) had continued to strengthen against the US Dollar (USD), as the USD/CAD failed to clear solid resistance in the form of the 100-day EMA at 1.3418 and the 20-day EMA at 1.3420. Nevertheless, the USD/CAD bias is bullish as long as the exchange rates hold above the 200-day EMA, which is meandering around 1.3253.

USD/CAD traders should be aware of a break of a support trendline drawn from the lows of November, which could pave the way for further losses. Oscillators-wise, the Relative Strength Index (RSI) continued its bearish path, while the Rate of Change (RoC) indicates consolidation lying ahead as volatility remains low.

The USD/CAD key support levels would be the 1.3300 figure. A break below, and the USD/CAD could test the 200-day EMA at 1.3253. Once cleared, the pair’s next demand area will be the November 15 low at 1.3225, followed by 1.3200.

As an alternate scenario, if the USD/CAD edges up, its first supply area would be the upslope support trendline broken on Thursday at around 1.3330/40. Once reclaimed, the confluence of the 20/100-day EMAs around 1.3418/20 would be next, and then the January 19 high at 1.3520.

USD/CAD Key Technical Levels

USD/CAD

Overview
Today last price 1.3322
Today Daily Change -0.0063
Today Daily Change % -0.47
Today daily open 1.3385
 
Trends
Daily SMA20 1.3455
Daily SMA50 1.3504
Daily SMA100 1.352
Daily SMA200 1.3202
 
Levels
Previous Daily High 1.3428
Previous Daily Low 1.334
Previous Weekly High 1.3521
Previous Weekly Low 1.3351
Previous Monthly High 1.3705
Previous Monthly Low 1.3385
Daily Fibonacci 38.2% 1.3394
Daily Fibonacci 61.8% 1.3374
Daily Pivot Point S1 1.3341
Daily Pivot Point S2 1.3296
Daily Pivot Point S3 1.3253
Daily Pivot Point R1 1.3429
Daily Pivot Point R2 1.3472
Daily Pivot Point R3 1.3517


Share: Feed news

Information on these pages contains forward-looking statements that involve risks and uncertainties. Markets and instruments profiled on this page are for informational purposes only and should not in any way come across as a recommendation to buy or sell in these assets. You should do your own thorough research before making any investment decisions. FXStreet does not in any way guarantee that this information is free from mistakes, errors, or material misstatements. It also does not guarantee that this information is of a timely nature. Investing in Open Markets involves a great deal of risk, including the loss of all or a portion of your investment, as well as emotional distress. All risks, losses and costs associated with investing, including total loss of principal, are your responsibility. The views and opinions expressed in this article are those of the authors and do not necessarily reflect the official policy or position of FXStreet nor its advertisers. The author will not be held responsible for information that is found at the end of links posted on this page.

If not otherwise explicitly mentioned in the body of the article, at the time of writing, the author has no position in any stock mentioned in this article and no business relationship with any company mentioned. The author has not received compensation for writing this article, other than from FXStreet.

FXStreet and the author do not provide personalized recommendations. The author makes no representations as to the accuracy, completeness, or suitability of this information. FXStreet and the author will not be liable for any errors, omissions or any losses, injuries or damages arising from this information and its display or use. Errors and omissions excepted.

The author and FXStreet are not registered investment advisors and nothing in this article is intended to be investment advice.

Recommended content


Recommended content

Editors’ Picks

EUR/USD climbs above 1.0900, looks to post weekly gains

EUR/USD climbs above 1.0900, looks to post weekly gains

EUR/USD gathers bullish momentum and trades above 1.0900 in the American session on Friday, looking to end the week in positive territory. The US Dollar remains under strong selling pressure following the disappointing jobs data, helping the pair push higher.

EUR/USD News

GBP/USD clings to daily gains near 1.2800 after weak US jobs data

GBP/USD clings to daily gains near 1.2800 after weak US jobs data

GBP/USD clings to daily gains at around 1.2800 in the second half of the day on Friday. Nonfarm Payrolls in the US rose by 114,000 in July. This reading missed the market expectation of 175,000 by a wide margin and triggered a USD selloff.

GBP/USD News

Gold pulls away from daily highs, holds above $2,420

Gold pulls away from daily highs, holds above $2,420

After coming within a touching distance of a new all-time high near $2,480 with the immediate reaction to disappointing US labor market data on Friday, Gold reversed its direction and declined below $2,420. Profit-taking ahead of the weekend might be weighing on XAU/USD.

Gold News

Bitcoin bounces off from the ascending trendline

Bitcoin bounces off from the ascending trendline

Bitcoin and Ethereum have retested their key support levels, with a break below these levels potentially signaling a bearish trend ahead. At the same time, Ripple shows resilience and could rally in the coming days after testing its key support level.

Read more

Week ahead – RBA and BoJ summary of opinions take center stage

Week ahead – RBA and BoJ summary of opinions take center stage

RBA decides on policy as hike bets disappear. BoJ Summary of Opinions awaited for more hike hints. After Fed, Dollar turns to ISM non-manufacturing PMI. New Zealand and Canada jobs data also on tap.

Read more

Forex MAJORS

Cryptocurrencies

Signatures