|

USD/CAD Price Analysis: The key contention level is seen above 1.3650

  • USD/CAD extends its downside to 1.3700 on the weaker USD.
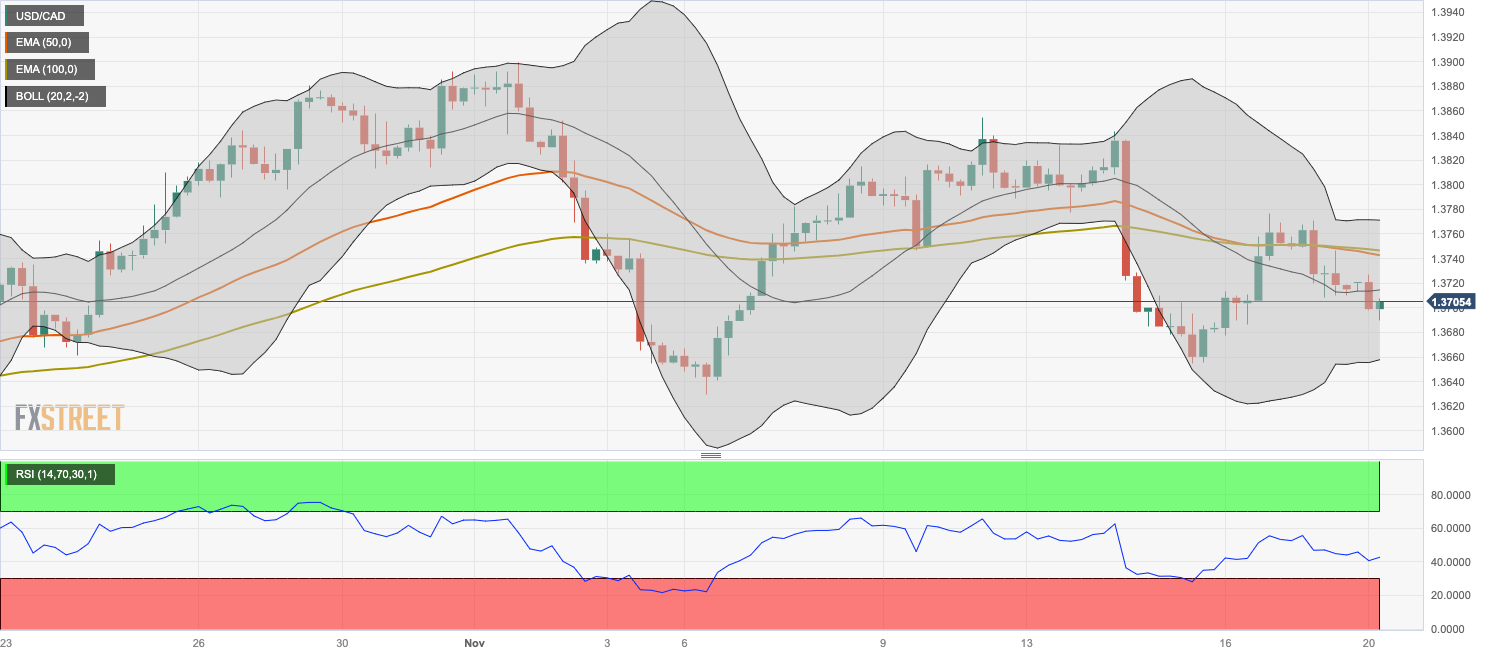
  • The bearish outlook for USD/CAD remains intact below the 50- and 100-day EMAs.
  • The first upside barrier will emerge at 1.3745; the critical support level is seen at 1.3655.

The USD/CAD pair loses momentum around 1.3700 during the early European session on Monday. The recovery of oil prices lifts the commodity-linked Loonie, as the country is the leading oil exporter to the US. Meanwhile, the US Dollar Index (DXY) drops to 103.70, the lowest since mid-July. Market players await the Federal Open Market Committee (FOMC) Meeting Minutes and Canadian inflation data on Tuesday for fresh impetus. The annual and monthly Canadian Consumer Price Index (CPI) is expected to rise by 3.2% and 0.1%, respectively.

Technically, the bearish outlook for USD/CAD remains intact as the pair holds below the 50- and 100-day Exponential Moving Averages (EMAs) on the four-hour chart. Additionally, the Relative Strength Index (RSI) is located in the bearish territory below 50, which means the path of the least resistance of USD/CAD is to the downside.

The immediate resistance level for the pair will emerge near the 100-EMA at 1.3745. The next barrier to watch is near the upper boundary of the Bollinger Band at 1.3771. Any decisive follow-through buying above the latter will see a rally to a high of November 14 at 1.3843, en route to a high of October 27 at 1.3880.

On the other hand, the critical support level is seen at 1.3655. The mentioned level is the confluence of the lower limit of the Bollinger Band and a low of November 15. The next contention level is located near a low of November 6 at 1.3629. A break below the latter will see a drop to the 1.3600-1.3605 zone, portraying the psychological round mark and a low of October 16. The additional downside filter to watch is a low of October 12 at 1.3578.

USD/CAD four-hour chart

USD/CAD

Overview
Today last price1.3705
Today Daily Change-0.0010
Today Daily Change %-0.07
Today daily open1.3715
 
Trends
Daily SMA201.377
Daily SMA501.3661
Daily SMA1001.3524
Daily SMA2001.3509
 
Levels
Previous Daily High1.3771
Previous Daily Low1.3708
Previous Weekly High1.3844
Previous Weekly Low1.3655
Previous Monthly High1.3892
Previous Monthly Low1.3562
Daily Fibonacci 38.2%1.3732
Daily Fibonacci 61.8%1.3747
Daily Pivot Point S11.3692
Daily Pivot Point S21.3669
Daily Pivot Point S31.3629
Daily Pivot Point R11.3755
Daily Pivot Point R21.3794
Daily Pivot Point R31.3817

Author

Lallalit Srijandorn

Lallalit Srijandorn is a Parisian at heart. She has lived in France since 2019 and now becomes a digital entrepreneur based in Paris and Bangkok.

More from Lallalit Srijandorn
Share:

Editor's Picks

EUR/USD rises to 1.1800 neighborhood amid renewed USD selling and trade uncertainties

The EUR/USD pair regains positive traction during the Asian session on Wednesday and jumps to the 1.1800 neighborhood in the last hour, reversing the previous day's modest losses. The intraday move up is sponsored by the emergence of fresh US Dollar, which continues to be weighed down by persistent trade-related uncertainties.

GBP/USD remains stronger above 1.3500 following Trump’s State of the Union

GBP/USD remains in the positive territory for the fourth successive session, trading around 1.3510 during the Asian hours on Wednesday. The pair appreciates as the US Dollar remains subdued following US President Donald Trump’s first State of the Union address of his second administration before a joint session of Congress.

Gold re-attempts $5,200 amid tariffs and geopolitical woes

Gold buyers are back in the game early Wednesday after seeing a correction from monthly highs on Tuesday. The US Dollar slips after Trump’s SOTU fails to impress and as AI-driven worries ease. Dovish Fed bets also weigh.  Gold looks north so long as the key 61.8% Fibo resistance at $5,142 holds on the daily chart.

Bitcoin, Ethereum and Ripple post cautious recovery amid downside risks

Bitcoin, Ethereum, and Ripple are posting a cautious recovery on Wednesday following a market correction earlier this week.  BTC is approaching a key breakdown level, while ETH and XRP are rebounding from crucial support levels.

The Citrini report: How a debatable AI narrative can shake Wall Street

That AI-related headline alone was enough to rattle investors.US stocks slid sharply on Monday after a widely circulated Citrini Research memo outlined a hypothetical “2028 Global Intelligence Crisis”, warning that rapid AI adoption could push US unemployment into double digits as early as by mid-2028.

XRP pressured by weak ETF flows and declining retail interest

Ripple (XRP) is edging lower, trading above its intraday low of $1.32 at the time of writing on Tuesday. The decline from its weekly opening of $1.39 reflects heightened volatility in the broader cryptocurrency market, accentuated by tariff-triggered uncertainty.