USD/CAD Price Analysis: Stuck in tight range below 1.3700
- USD/CAD oscillates in a tight range below 1.3700 ahead of crucial US economic data.
- The US inflation data will impact Fed rate-cut prospects for September.
- USD/CAD trades in a Descending Triangle pattern, suggesting indecisiveness among investors.

The USD/CAD pair stays on sidelines below the round-level resistance of 1.3700 in Tuesday’s European session. The Loonie asset consolidates as investors await the release of the United States Producer Price Index (PPI) and the Consumer Price Index (CPI) data for April, which will be published at 12:30 GMT and on Wednesday, respectively.
US producer and consumer inflation readings will provide fresh cues about the Federal Reserve’s (Fed) inflation outlook. The CME FedWatch tool indicates that the September meeting will be the earliest point from when the central bank will start reducing interest rates.
Meanwhile, the market sentiment is cautious ahead of US inflation data. S&P 500 futures remain flat in the European session. The US Dollar Index (DXY) rebounds from the crucial support of 105.00.
The Canadian Dollar attains a firm footing as strong Canadian job data for April has shaken investors’ confidence about the Bank of Canada (BoC) to begin reducing interest rates from the June meeting. Statistics Canada reported that Canadian employers hired 90.4K job-seekers in April, significantly higher than the consensus of 18K. In March, the job market recorded a lay-off of 2.2K employees. The Unemployment Rate remains steady at 6.1% while investors estimated the joblessness to rise to 6.2%.
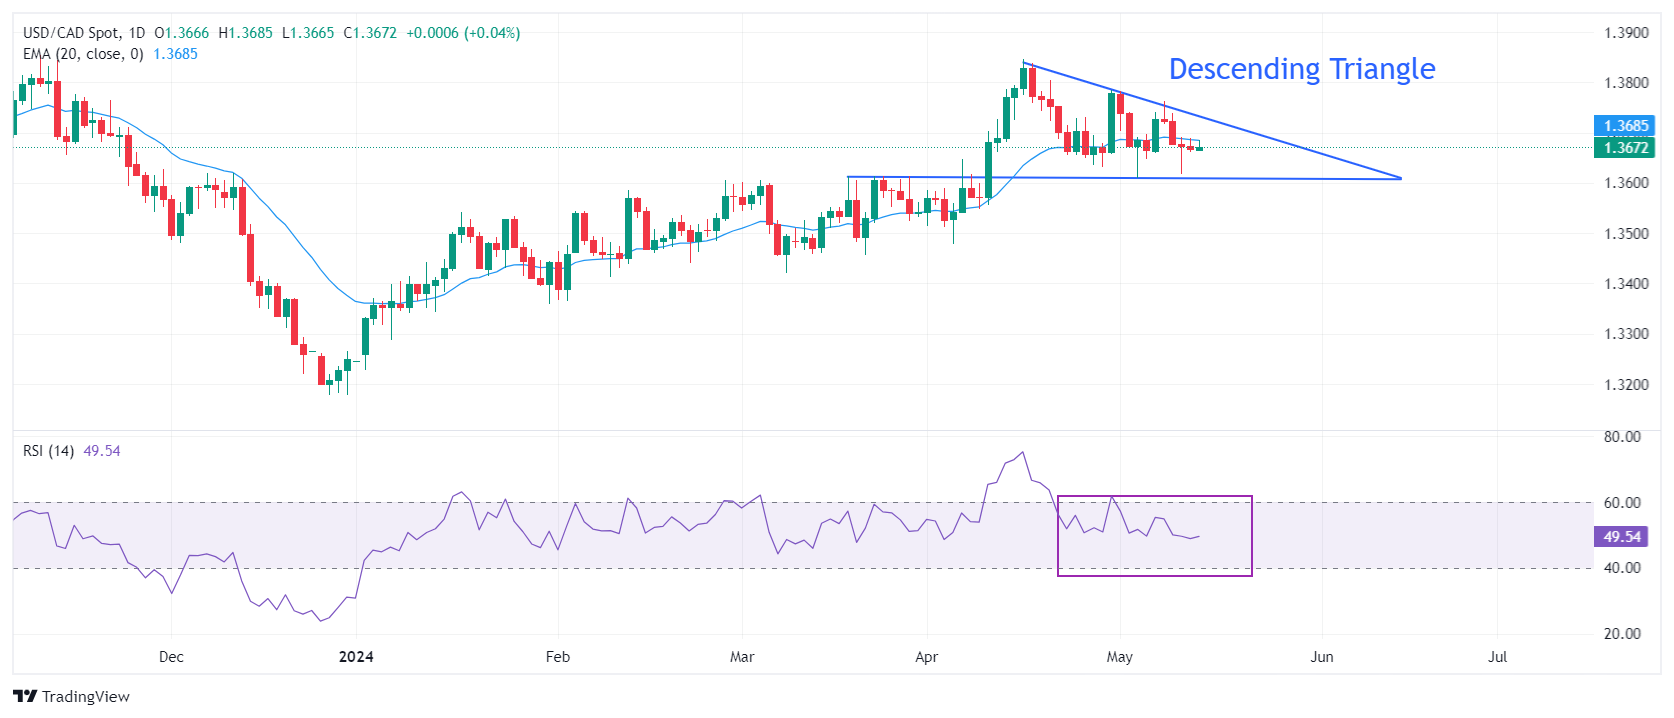
USD/CAD oscillates in a Descending Triangle chart formation on a daily timeframe. The downward-sloping border of the above-mentioned chart pattern is plotted from April 16 high at 1.3846, while the horizontal support is placed from March 19 high at 1.3614. The 20-day Exponential Moving Average (EMA) at 1.3684 continues to act as a major barricade for the US Dollar bulls.
The 14-period Relative Strength Index (RSI) remains inside the 40.00-60.00 range, suggesting a sharp volatility contraction.
Fresh buying opportunity would emerge if the asset breaks above April 30 high at 1.3785. This would drive the asset towards April 17 high at 1.3838, followed by the round-level resistance of 1.3900.
In an alternate scenario, a breakdown below May 3 low around 1.3600 will expose the asset to the April 9 low around 1.3547 and the psychological support of 1.3500.
USD/CAD daily chart
Author

Sagar Dua
FXStreet
Sagar Dua is associated with the financial markets from his college days. Along with pursuing post-graduation in Commerce in 2014, he started his markets training with chart analysis.


