- USD/CAD stays on the sidelines above 1.3700 amid uncertainty over the timeframe for Fed rate cuts.
- US customers cut heavily on discretionary spending, which indicates a decline in purchasing power.
- Canadian Retail Sales are expected to have returned in a positive trajectory.
The USD/CAD pair trades in a tight range but comfortably holds the crucial support of 1.3700 in Wednesday’s European session. The Loonie asset consolidates amid uncertainty over the Federal Reserve’s (Fed) rate-cut path due to the divergence between the Fed’s projections and market expectations for how much interest rates will be reduced this year.
Fed policymakers signalled one rate-cut this year in its last dot plot. However, financial markets strongly expect two as the latest United States (US) Consumer Price Index (CPI) report for May indicated that the progress in the disinflation process has resumed. Also, the Retail Sales for May indicated that consumers cut heavily on discretionary spending. This has built confidence among investors that inflation is progressively declining towards the 2% target.
Meanwhile, Fed officials want to see inflation declining for months before considering rate cuts. Improving expectations for Fed rate cuts have limited the upside in the US Dollar (USD). The US Dollar Index (DXY), which tracks the greenback’s value against six major currencies, trades sideways around 105.20.
On the Loonie front, investors await the Canadian Retail Sales data for April, which will be published on Friday. Monthly Retail Sales are anticipated to have returned to a positive trajectory after contracting for three straight months. The economic data is estimated to have increased by 0.7%.
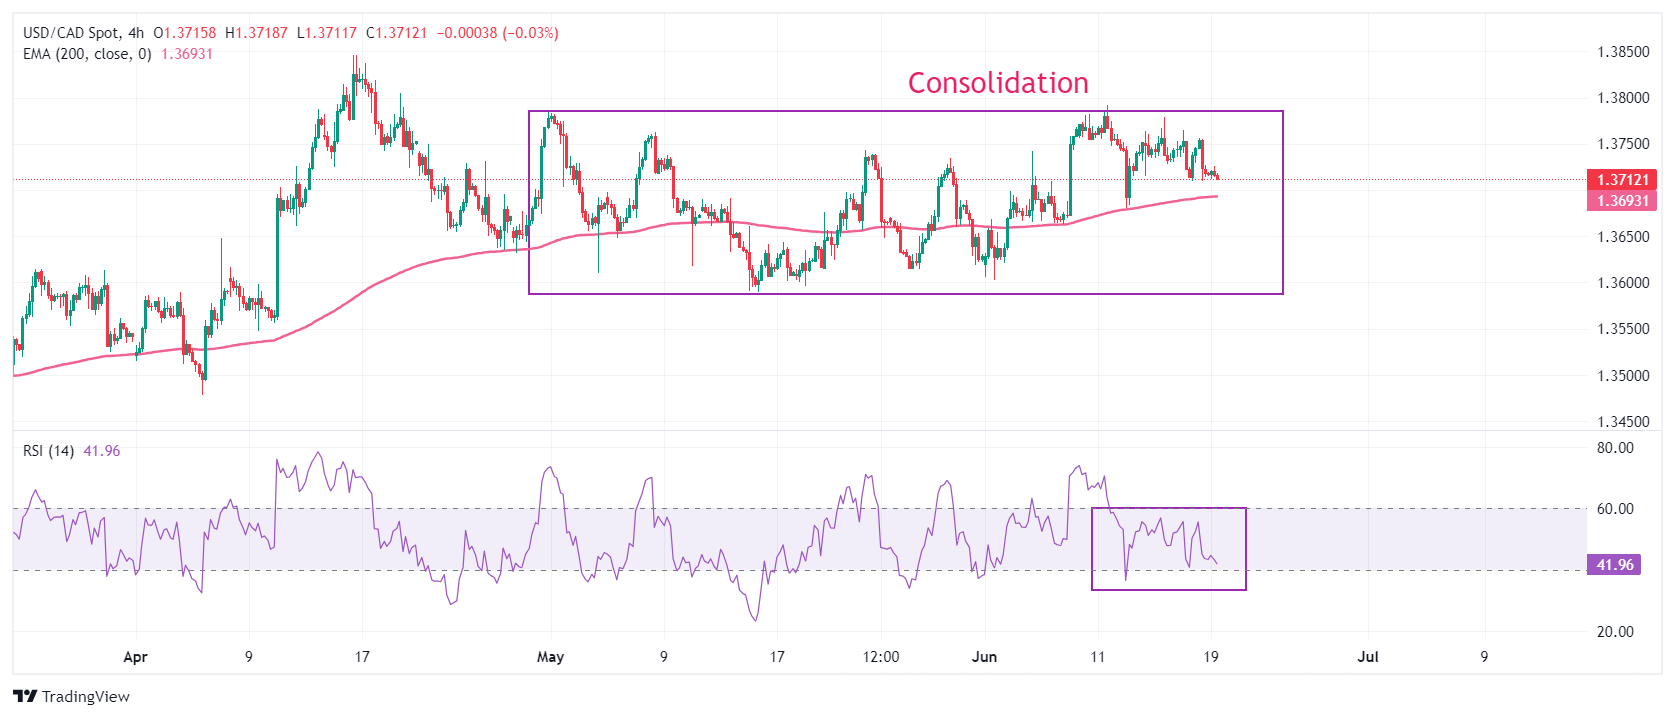
USD/CAD continues to consolidate in the 1.3600-1.3800 range from almost seven weeks. The Loonie asset holds the 200-day Exponential Moving Average (EMA), which trades around 1.3690, suggesting that the overall trend is bullish.
The 14-period Relative Strength Index (RSI) oscillates in the 40.00-60.00 range, indicating indecisiveness among market participants.
A fresh buying opportunity would emerge if the asset breaks above the April 17 high at 1.3838. This would drive the asset towards 1 November 2023 high at 1.3900, followed by the psychological resistance of 1.4000.
In an alternate scenario, a breakdown below June 7 low at 1.3663 will expose the asset to May 3 low around 1.3600 and April 9 low around 1.3547.
USD/CAD four-hour chart
Information on these pages contains forward-looking statements that involve risks and uncertainties. Markets and instruments profiled on this page are for informational purposes only and should not in any way come across as a recommendation to buy or sell in these assets. You should do your own thorough research before making any investment decisions. FXStreet does not in any way guarantee that this information is free from mistakes, errors, or material misstatements. It also does not guarantee that this information is of a timely nature. Investing in Open Markets involves a great deal of risk, including the loss of all or a portion of your investment, as well as emotional distress. All risks, losses and costs associated with investing, including total loss of principal, are your responsibility. The views and opinions expressed in this article are those of the authors and do not necessarily reflect the official policy or position of FXStreet nor its advertisers. The author will not be held responsible for information that is found at the end of links posted on this page.
If not otherwise explicitly mentioned in the body of the article, at the time of writing, the author has no position in any stock mentioned in this article and no business relationship with any company mentioned. The author has not received compensation for writing this article, other than from FXStreet.
FXStreet and the author do not provide personalized recommendations. The author makes no representations as to the accuracy, completeness, or suitability of this information. FXStreet and the author will not be liable for any errors, omissions or any losses, injuries or damages arising from this information and its display or use. Errors and omissions excepted.
The author and FXStreet are not registered investment advisors and nothing in this article is intended to be investment advice.
Recommended content
Editors’ Picks
Australian Dollar steady as markets asses minor US data
The AUD/USD regained positive traction on Thursday following the overnight pullback from a one-week top. A softer US Dollar and a positive risk tone benefited the Aussie, as well as the Reserve Bank of Australia’s (RBA) hawkish stance.

EUR/USD: Further losses now look at 1.0450
Further strength in the US Dollar kept the price action in the risk-associated assets depressed, sending EUR/USD back to the 1.0460 region for the first time since early October 2023 prior to key releases in the real economy.

Gold faces extra upside near term
Gold extends its bullish momentum further above $2,660 on Thursday. XAU/USD rises for the fourth straight day, sponsored by geopolitical risks stemming from the worsening Russia-Ukraine war. Markets await comments from Fed policymakers.

Ethereum Price Forecast: ETH open interest surge to all-time high after recent price rally
Ethereum (ETH) is trading near $3,350, experiencing an 10% increase on Thursday. This price surge is attributed to strong bullish sentiment among derivatives traders, driving its open interest above $20 billion for the first time.

A new horizon: The economic outlook in a new leadership and policy era
The economic aftershocks of the COVID pandemic, which have dominated the economic landscape over the past few years, are steadily dissipating. These pandemic-induced economic effects are set to be largely supplanted by economic policy changes that are on the horizon in the United States.

Best Forex Brokers with Low Spreads
VERIFIED Low spreads are crucial for reducing trading costs. Explore top Forex brokers offering competitive spreads and high leverage. Compare options for EUR/USD, GBP/USD, USD/JPY, and Gold.